

What this is for
Dashboard → Usage aggregates request and token telemetry from every attached gateway into one view. Use it to find which apps drive the most traffic, compare provider/model behavior over time, and inform routing or quota decisions. For cost, see the sibling Spend tab. For guardrail analytics, see Security.Options
Time range
Same dropdown that drives Overview:Last Hour, Last 24 Hours, Last 7 Days, Last 30 Days.
Filters
- Gateway — multi-select; leave empty for all.
- Provider — multi-select.
- API Key — multi-select.
Breakdowns
| Breakdown | Why it’s useful |
|---|---|
| Per gateway | Spot a noisy environment or a regional imbalance. |
| Per team | Confirm fairness across business units. |
| Per API key | Find the application driving volume. |
| Per provider | Decide whether to switch a workload. |
| Per model | Latency / quality tradeoff analysis. |
How to configure
This is a read-only analytics view — no configuration on the page itself.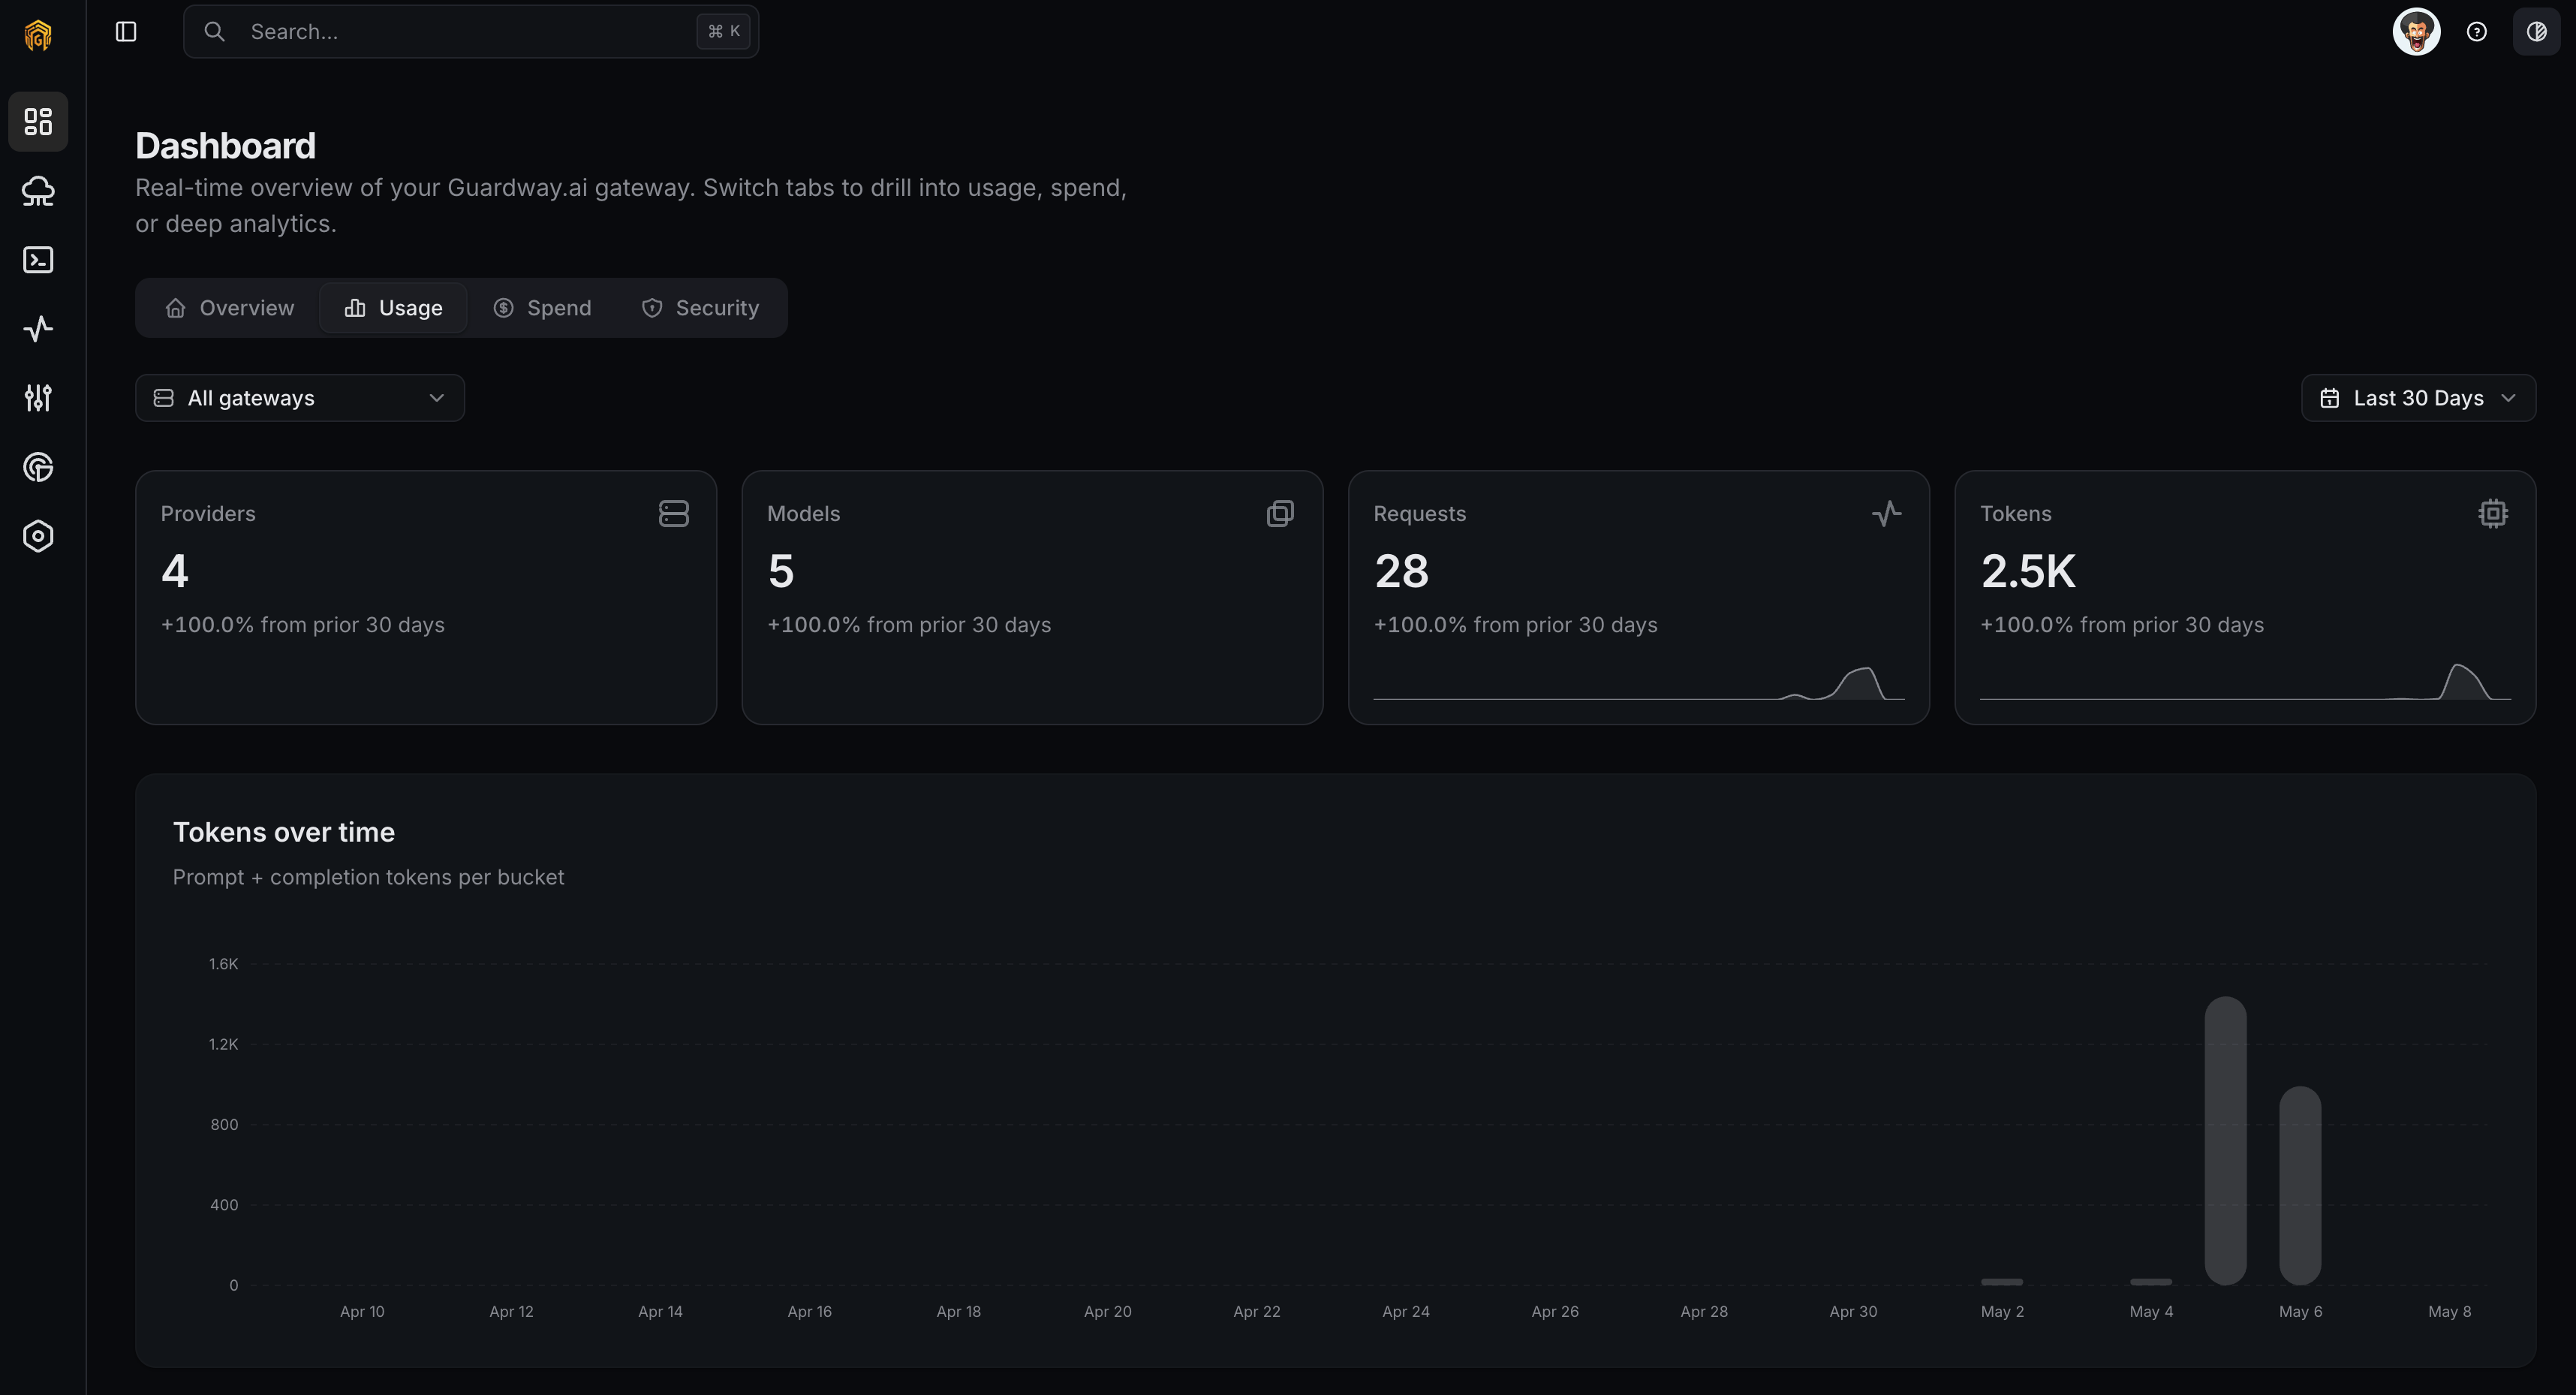
Open Dashboard → Usage
Open Dashboard → Overview from the dashboard sidebar and click the Usage tab.
Filter and pivot
Add Gateway, Provider, or API Key filters. Switch the Group by selector between gateway, team, API key, provider, and model.
What this view does not show
Raw prompts and completions stay on the gateway. To inspect them, open Logs while connected to that gateway. Administrative actions are recorded centrally on the Audit log.Related
- Spend — cost view of the same telemetry.
- Logs — request-level drill-in.
- Notifications — alert when usage crosses a threshold.