

What this is for
Topology is the live graph of how inference traffic flows through your Guardway estate. It connects Gateways to the Providers attached to them, the Models those providers expose, and any Agents discovered in your cloud that target those models. Platform operators and security reviewers use it to see routing posture at a glance — which agents are attached to which models, whether a provider is healthy, and whether an agent node carries open OWASP findings — without opening each agent one by one. It lives at Topology in the dashboard sidebar (between Get Started and Gateways).The graph needs at least one registered gateway or a connected cloud-agent-discovery integration (Azure AI Foundry, Amazon Bedrock) before it renders meaningful nodes.
Options
Graph layout
The canvas reads left to right in four columns:
Edges between columns show how traffic and discovery relationships connect. Color follows node health — for example, a provider with zero models may render a warning-colored path.
Canvas controls
Selection and details
Clicking any node opens a details sheet on the right with context-specific fields — gateway environment and version, provider latency, model deployment list, or agent routing plus finding count. Clicking empty canvas clears the selection. Agent nodes link through to the Agents workspace when you need full OWASP remediation text or identity metadata.How to configure
There is no configuration on this page — it reflects gateways registered under Gateways, providers synced from Configuration → Providers, and agents discovered via Settings → Integrations.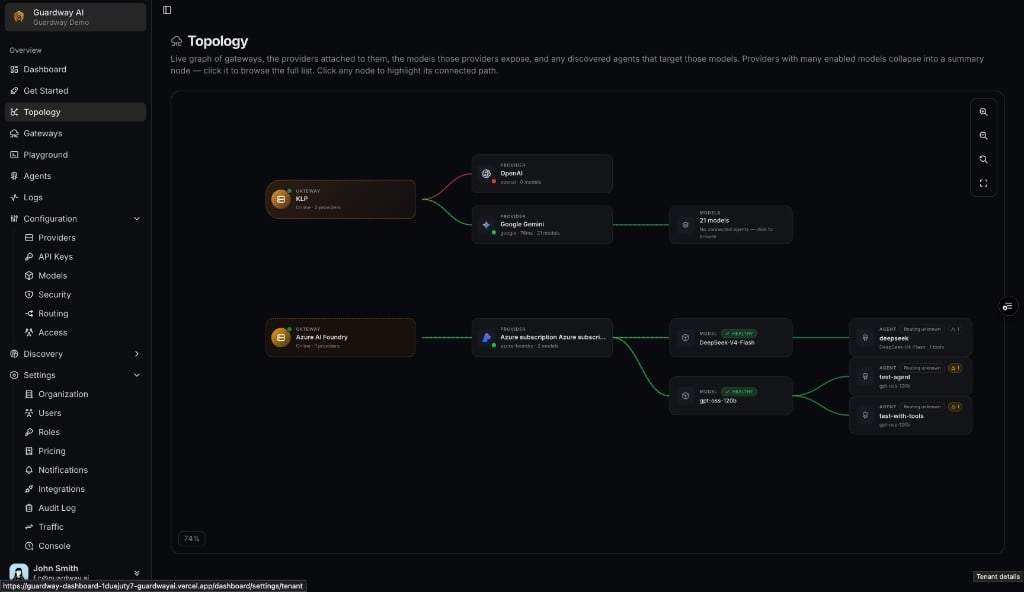
Topology — gateway → provider → model → agent graph
1
Open Topology
Select Topology from the dashboard sidebar.
2
Connect discovery or register a gateway
If the canvas is empty, connect Azure AI Foundry or Amazon Bedrock under Settings → Integrations, and/or register at least one gateway. Wait for the first agent sync or gateway heartbeat.
3
Explore the graph
Pan and zoom the canvas. Click a gateway, provider, model rollup, or agent node to highlight its path and read the details sheet.
4
Drill into agents
From an agent node, open the Agents workspace to review findings, identities, and tools in full detail.
Limits
- The graph synthesizes a Cloud provider → Account → Model chain for discovered agents whose model names do not match a provider already attached to a gateway — useful when agents call models your gateways have not registered yet.
- Agent routing badges on topology nodes use the same hostname heuristic as the Agents inventory — endpoints the connector cannot resolve stay Routing unknown.
- Topology refreshes on the same cadence as gateway and agent discovery data (roughly once per minute while the tab is visible); it is not a real-time packet trace.
Related
- Dashboard → Agents — org-wide agent metrics and finding breakdowns.
- Agents — per-agent inventory, findings list, and detail view.
- Gateways — register gateways so they appear in the first column.
- Settings → Integrations — connect cloud providers that populate agent nodes.