

What this is for
The Agents tab on the main Dashboard summarizes every AI agent Guardway has discovered across your connected cloud providers. It answers “how many agents do we have, how many route through our gateways, and where are the OWASP findings concentrated?” without opening the full Agents workspace. Security and platform leads use it as the daily snapshot; operators jump into Agents via Open Agents workspace when they need the inventory table or per-agent detail.Options
Tab bar
The Dashboard uses the same tab strip on every visit: Overview, Usage, Spend, Security, Agents, Adversarial. Selecting Agents loads this view (?tab=agents on the overview route).
Actions
Insight strip
When at least one high-signal condition is present, a banner above the stats highlights the top finding — for example Most findings: Identity & Privilege Abuse with a count and View link into the Agents → Findings tab pre-filtered to that category. When nothing notable is detected, the strip shows a neutral “no notable agent risks” message.Stat rail
Six headline metrics in a single row:Breakdown panels
Four linkable breakdown lists below the stat rail (top six rows each unless noted):How to configure
This tab is read-only. Connect a discovery integration under Settings → Integrations and register gateways under Gateways so routing and inventory populate.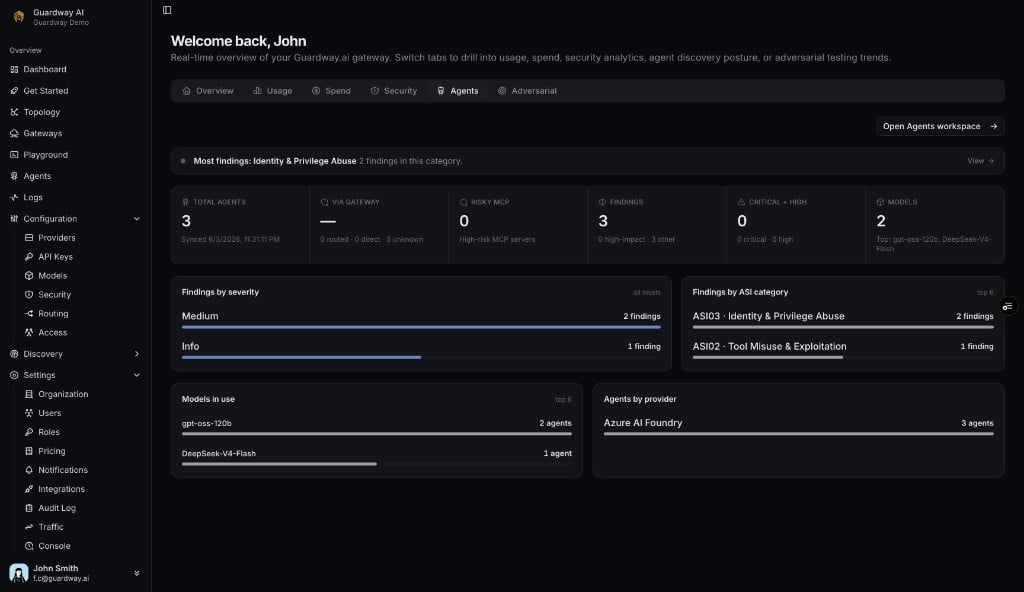
Dashboard → Agents tab
1
Open Dashboard
Select Dashboard from the sidebar (lands on Overview by default).
2
Select the Agents tab
Click Agents in the tab bar.
3
Read the stat rail
Review Total agents, Via gateway, Findings, and Critical + High for a quick health check.
4
Drill down
Click any breakdown row or View on the insight strip to open the Agents workspace with filters applied, or use Open Agents workspace for the full inventory.
Related
- Agents — Inventory, Findings, and per-agent detail.
- Topology — graph view of gateways → providers → models → agents.
- Settings → Integrations — connect Azure AI Foundry, Amazon Bedrock, and related services.