

What this is for
Dashboard → Security summarizes guardrail evaluations and MCP traffic from every attached gateway. Use it to spot bursts of blocks, find the most-triggered policies, and confirm MCP servers are getting the volume you expect. For request and token volume, see Usage. For cost, see Spend. To inspect individual events, open Logs on the relevant gateway.Options
Time range
Last 24 Hours, Last 7 Days, Last 30 Days. Comparisons against the previous window appear next to each stat.
Filters
- Gateway — multi-select; leave empty for all attached gateways.
Stat blocks
| Block | Metric |
|---|---|
| Total Blocks | Requests blocked by a guardrail in the window. |
| Total Events | Every guardrail evaluation (block + warn + redact + log). |
| MCP Requests | Total MCP tool calls across all attached servers. |
| MCP Avg Latency | Mean MCP tool-call latency in milliseconds. |
Charts and breakdowns
- Blocks over time — bucketed by the selected range.
- MCP requests over time — bucketed by the selected range.
- By severity —
Critical,High,Medium,Lowevent counts. - Triggered on — top categories that fired (e.g. PII detection, prompt injection, content filter).
- Event type — top event types observed.
- Top MCP servers — top 5 servers by request volume.
- Top MCP tools — top 5 tools by request volume.
How to configure
This is a read-only analytics view — guardrail policies and MCP servers are configured on Configuration → Security.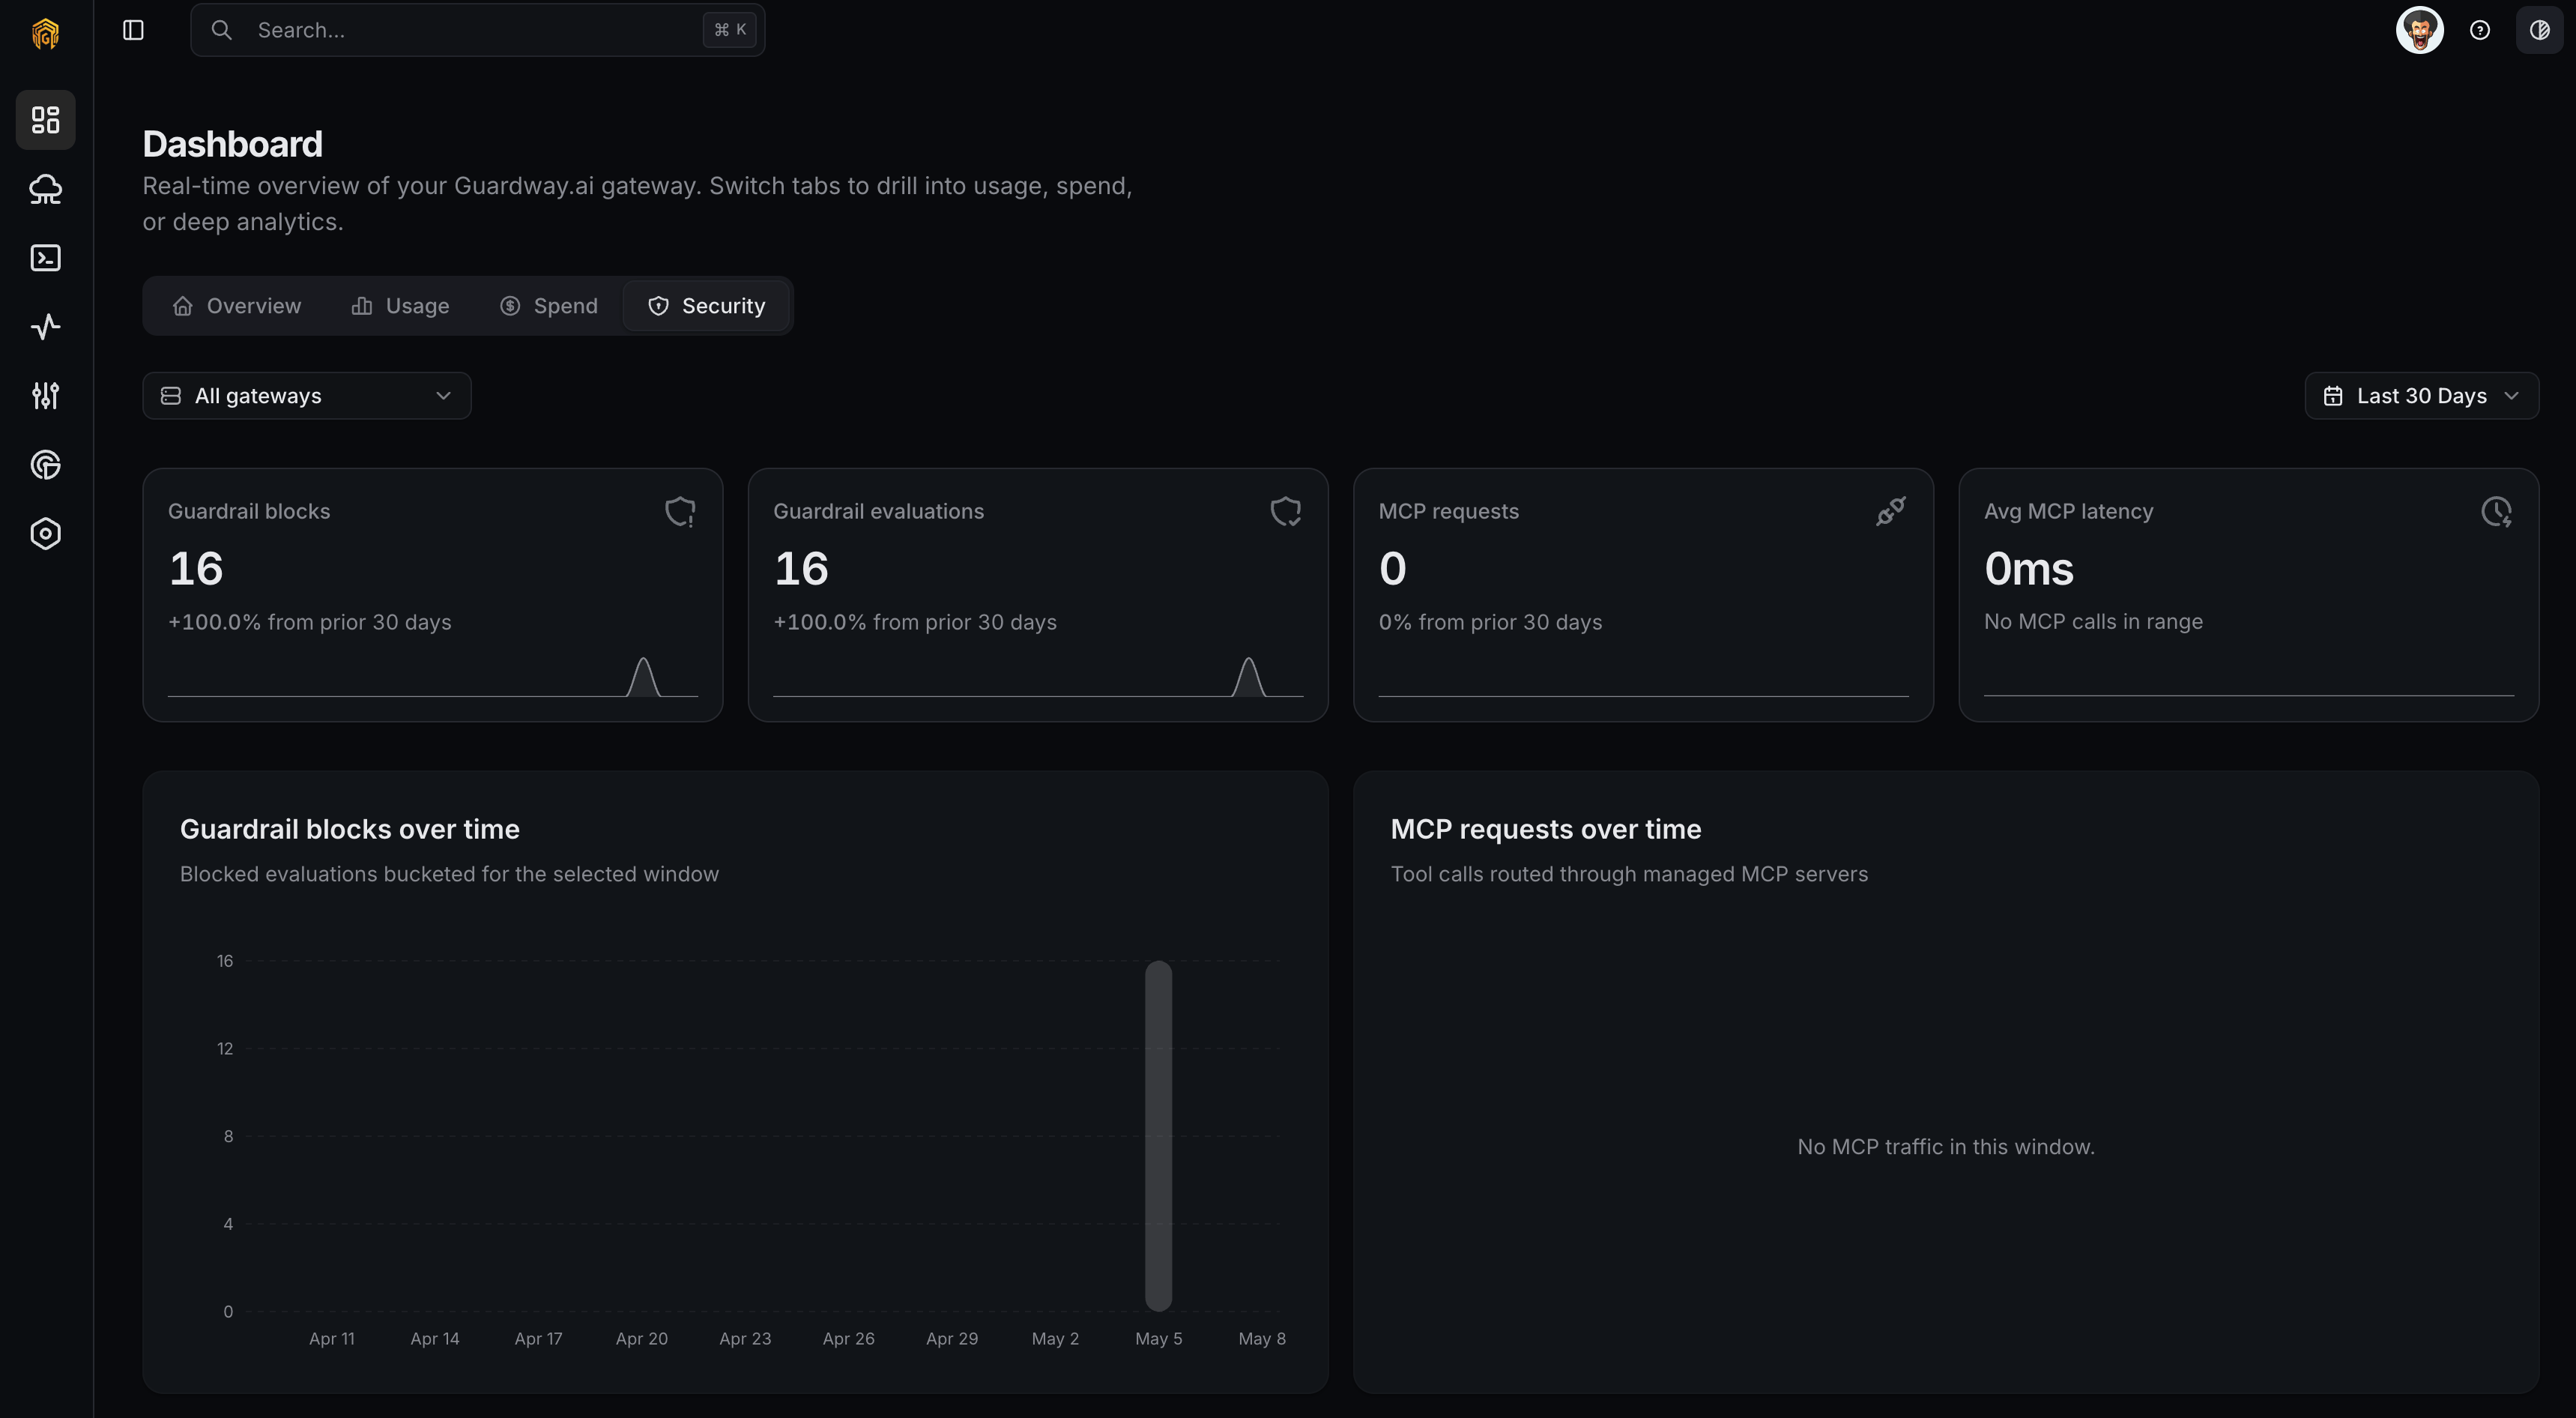
Open Dashboard → Security
Open Dashboard → Overview from the dashboard sidebar and click the Security tab.
Pick a window and gateways
Set Time range and optionally narrow to specific gateways with the Gateway filter.
Drill into a triggered category
Use the Triggered on breakdown to identify which guardrail fired most. Open Logs → Guardrails on the affected gateway to inspect individual evaluations.
Tune the policy
If a guardrail is over-firing or under-firing, adjust thresholds and actions on Configuration → Security.
Related
- Configuration → Security — guardrail policies, SLM Guardrails, MCP servers.
- Logs — guardrail evaluation and MCP request logs on a specific gateway.
- Notifications — fire on
guardrail.violation.