

What this is for
The Logs page is the operational view of traffic flowing through your gateway. It captures four complementary perspectives, organized as tabs:- Requests — flat, filterable table of every HTTP request the gateway served.
- MCP — every tool call made through an MCP server attached to the gateway.
- Guardrails — every guardrail rule trigger (input or output, blocked or logged).
- Traces — OpenTelemetry timelines showing how each request flowed through guardrails, auth, routing, cache, and the upstream provider.
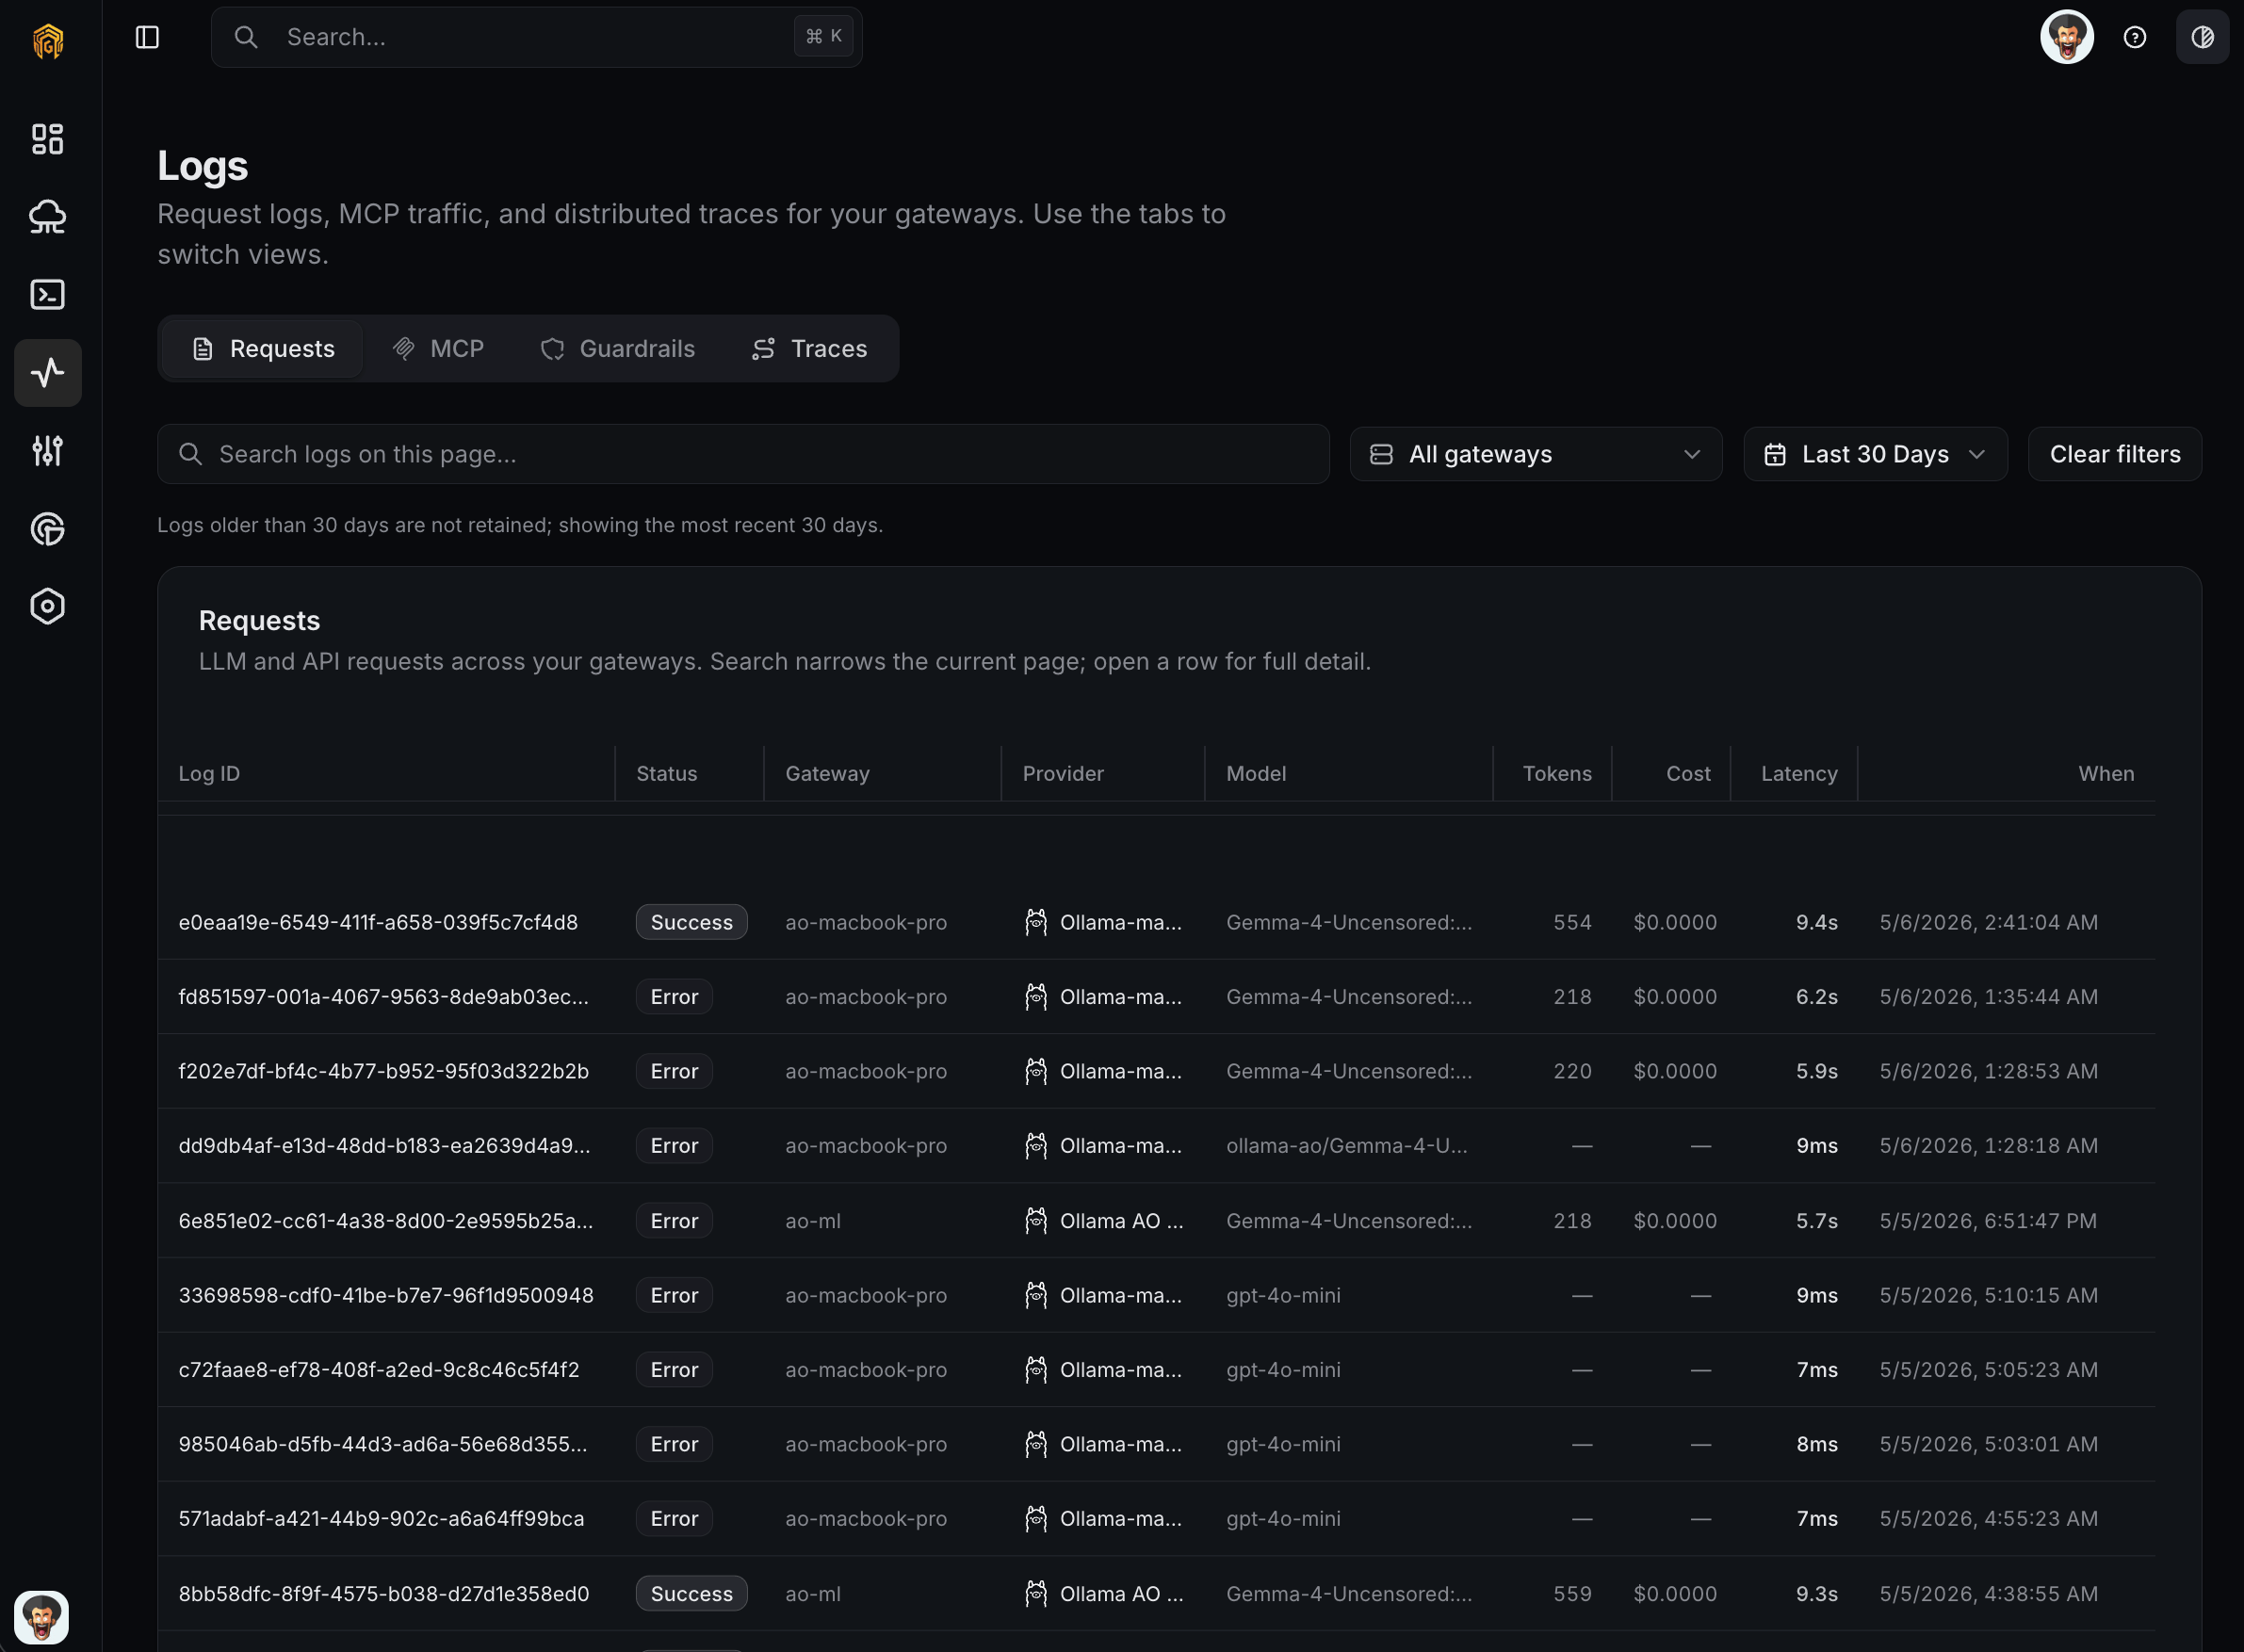
Requests
The default tab. A flat table of every HTTP request, sortable on any column.Columns
Timestamp, method, path, status, duration, provider, model, API key name, tokens (prompt + completion), cost, client IP, and trace ID.Filters
| Filter | Notes |
|---|---|
| Time range | Presets (1h, 24h, 7d, 30d) or a custom calendar. |
| Gateway | Multi-select. Leave empty for all gateways. |
| Provider | Multi-select. |
| API Key | Multi-select. |
| Search | Matches request path, model, or API key name. |
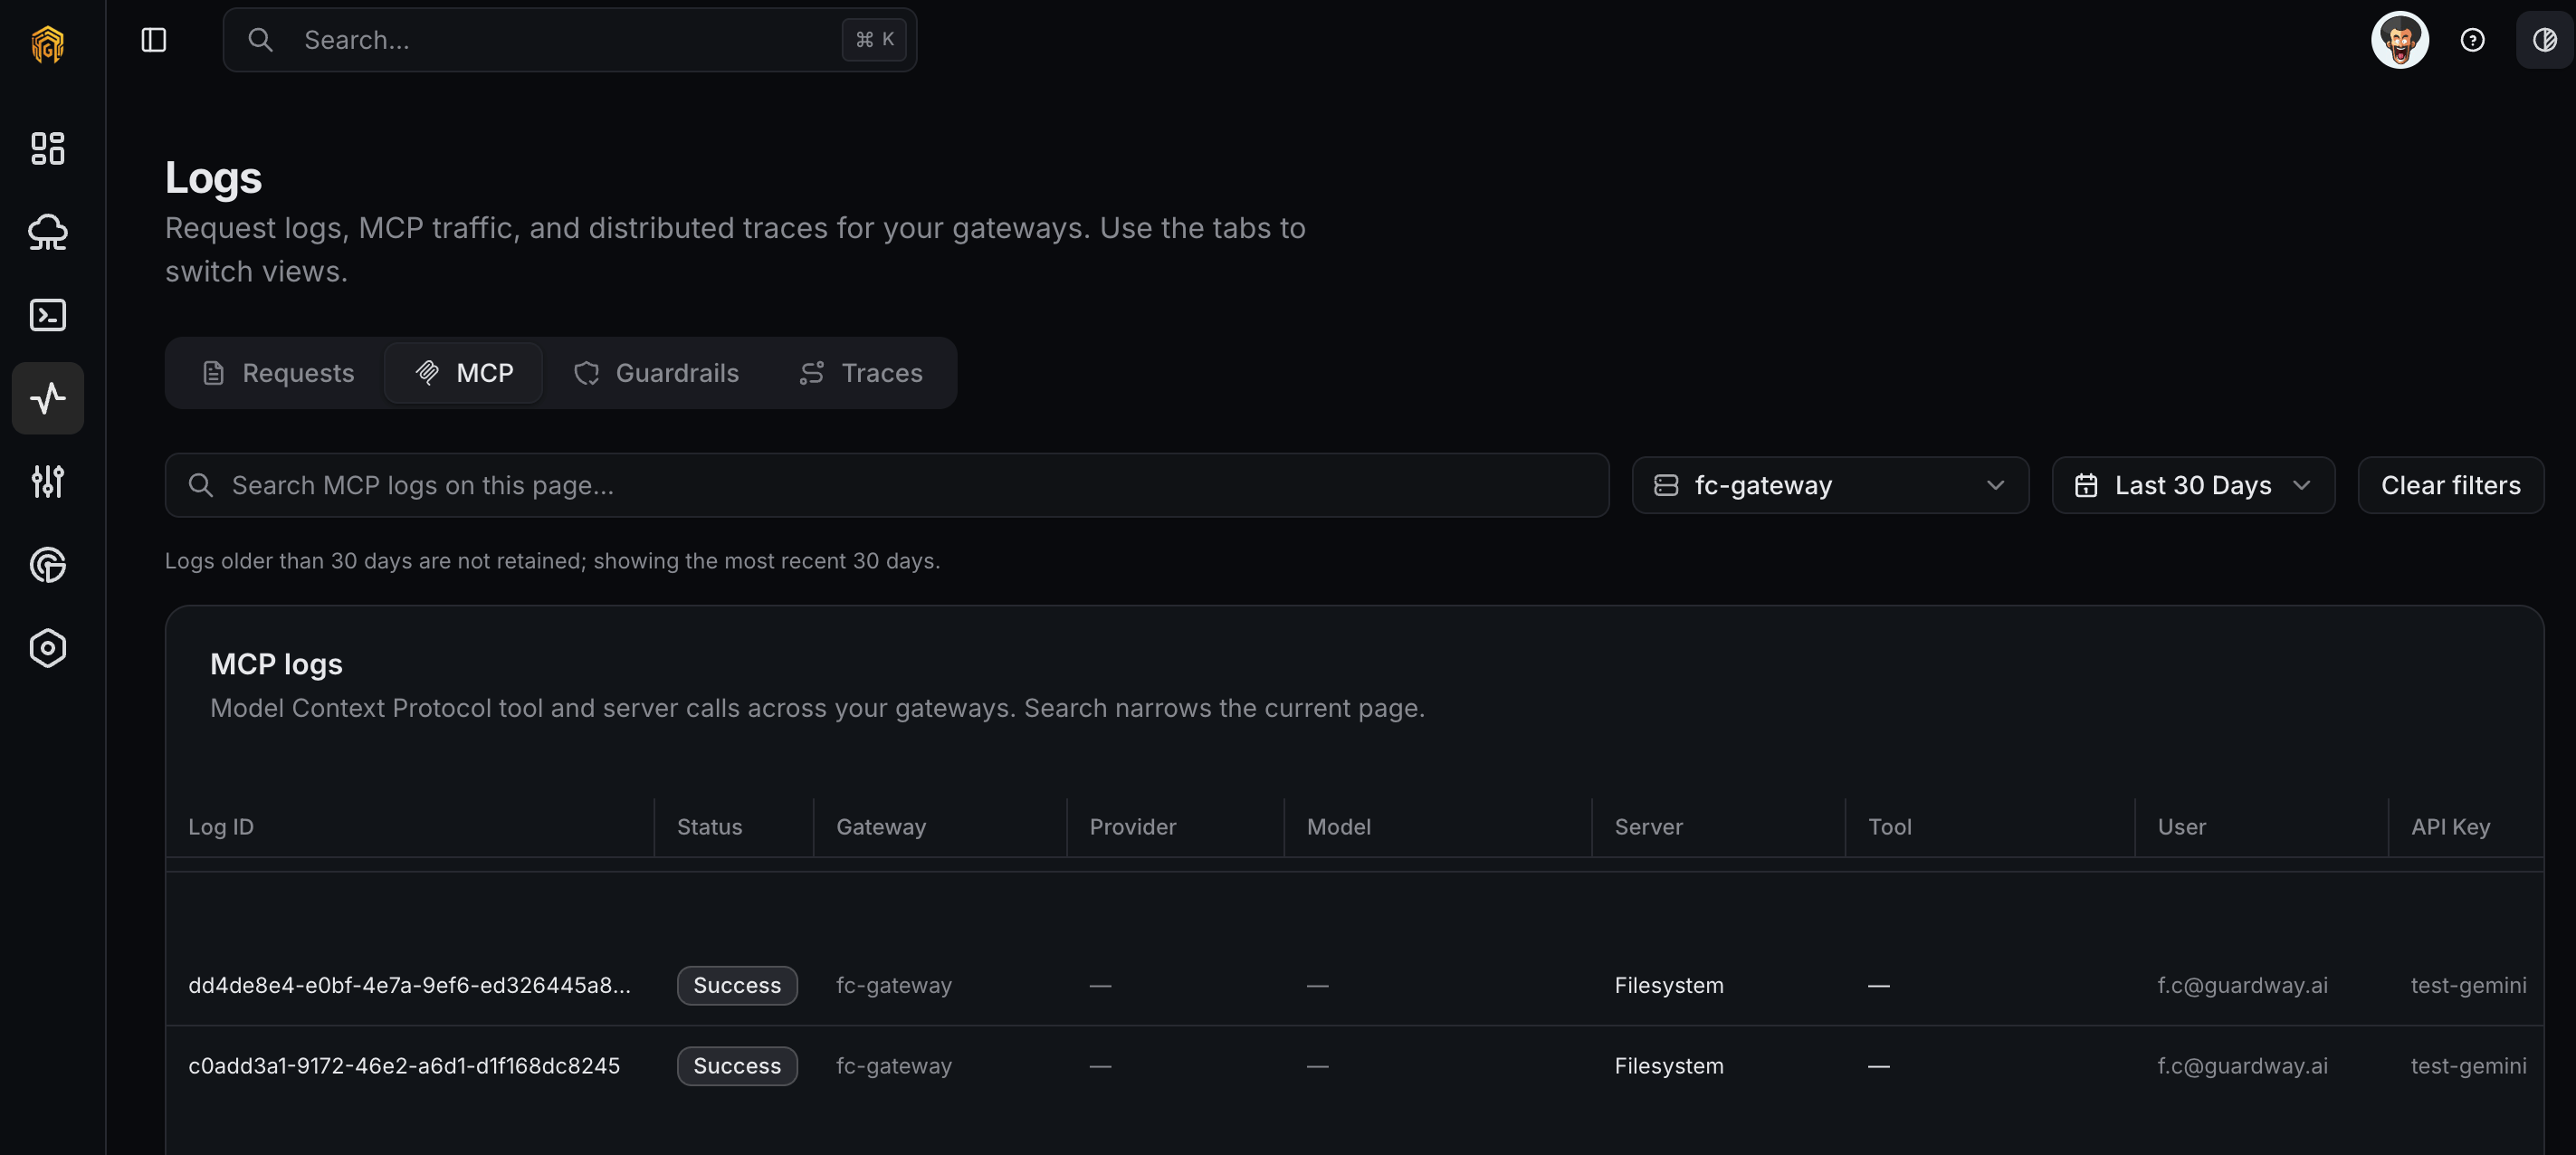
MCP
Every call to a tool exposed by an MCP server registered with the gateway is logged here.| Column | Notes |
|---|---|
| Timestamp | When the call was made. |
| MCP server | The server that handled the call. |
| Tool | The tool name. |
| Caller | The API key or session that invoked the tool. |
| Status | ok, error, or denied (blocked by MCP scope on the key). |
| Duration | Round-trip time. |
| Request / Response | JSON payload, viewable inline. |
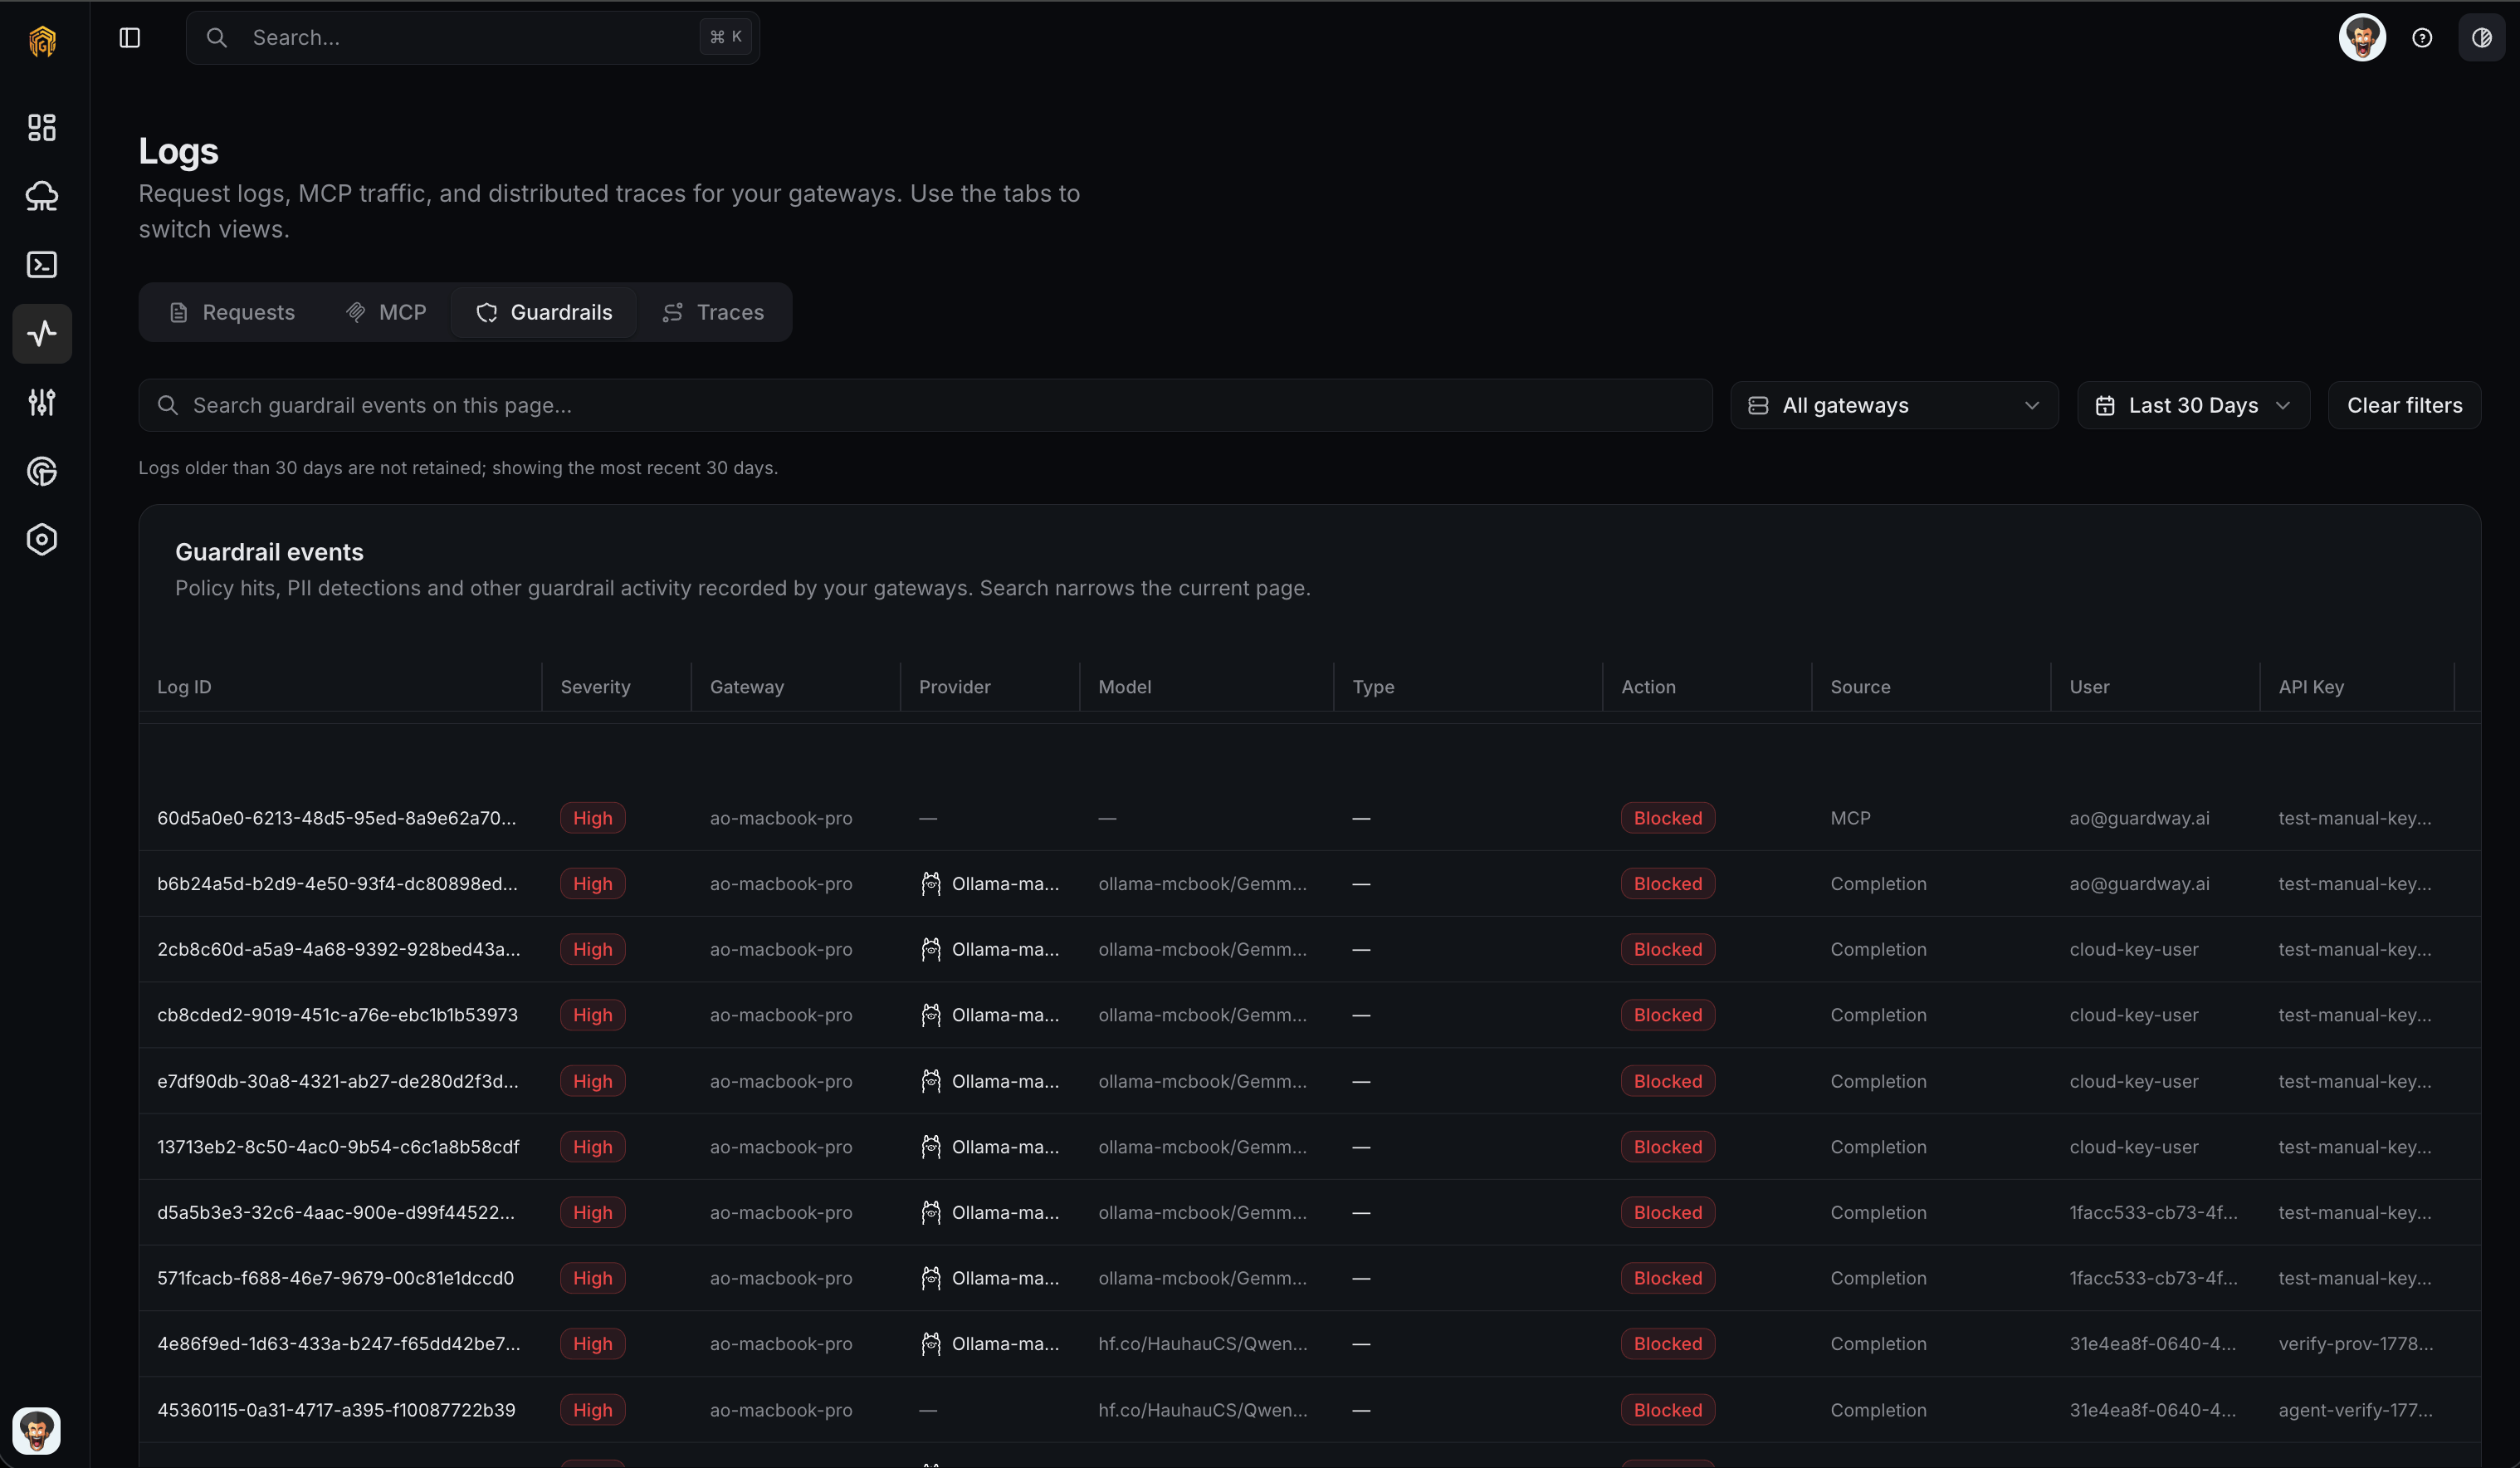
Guardrails
Every guardrail rule trigger — both rule-based (Guardrails) and SLM-based (SLM Guardrails) — is recorded here. Each row shows the rule name, category, action taken (block, warn, redact, log), the matched content (or its hash for redacted entries), and a link back to the originating request.
Use this tab to audit policy hits, tune thresholds before promoting an SLM model to a blocking action, and confirm a rule is matching what you expect.
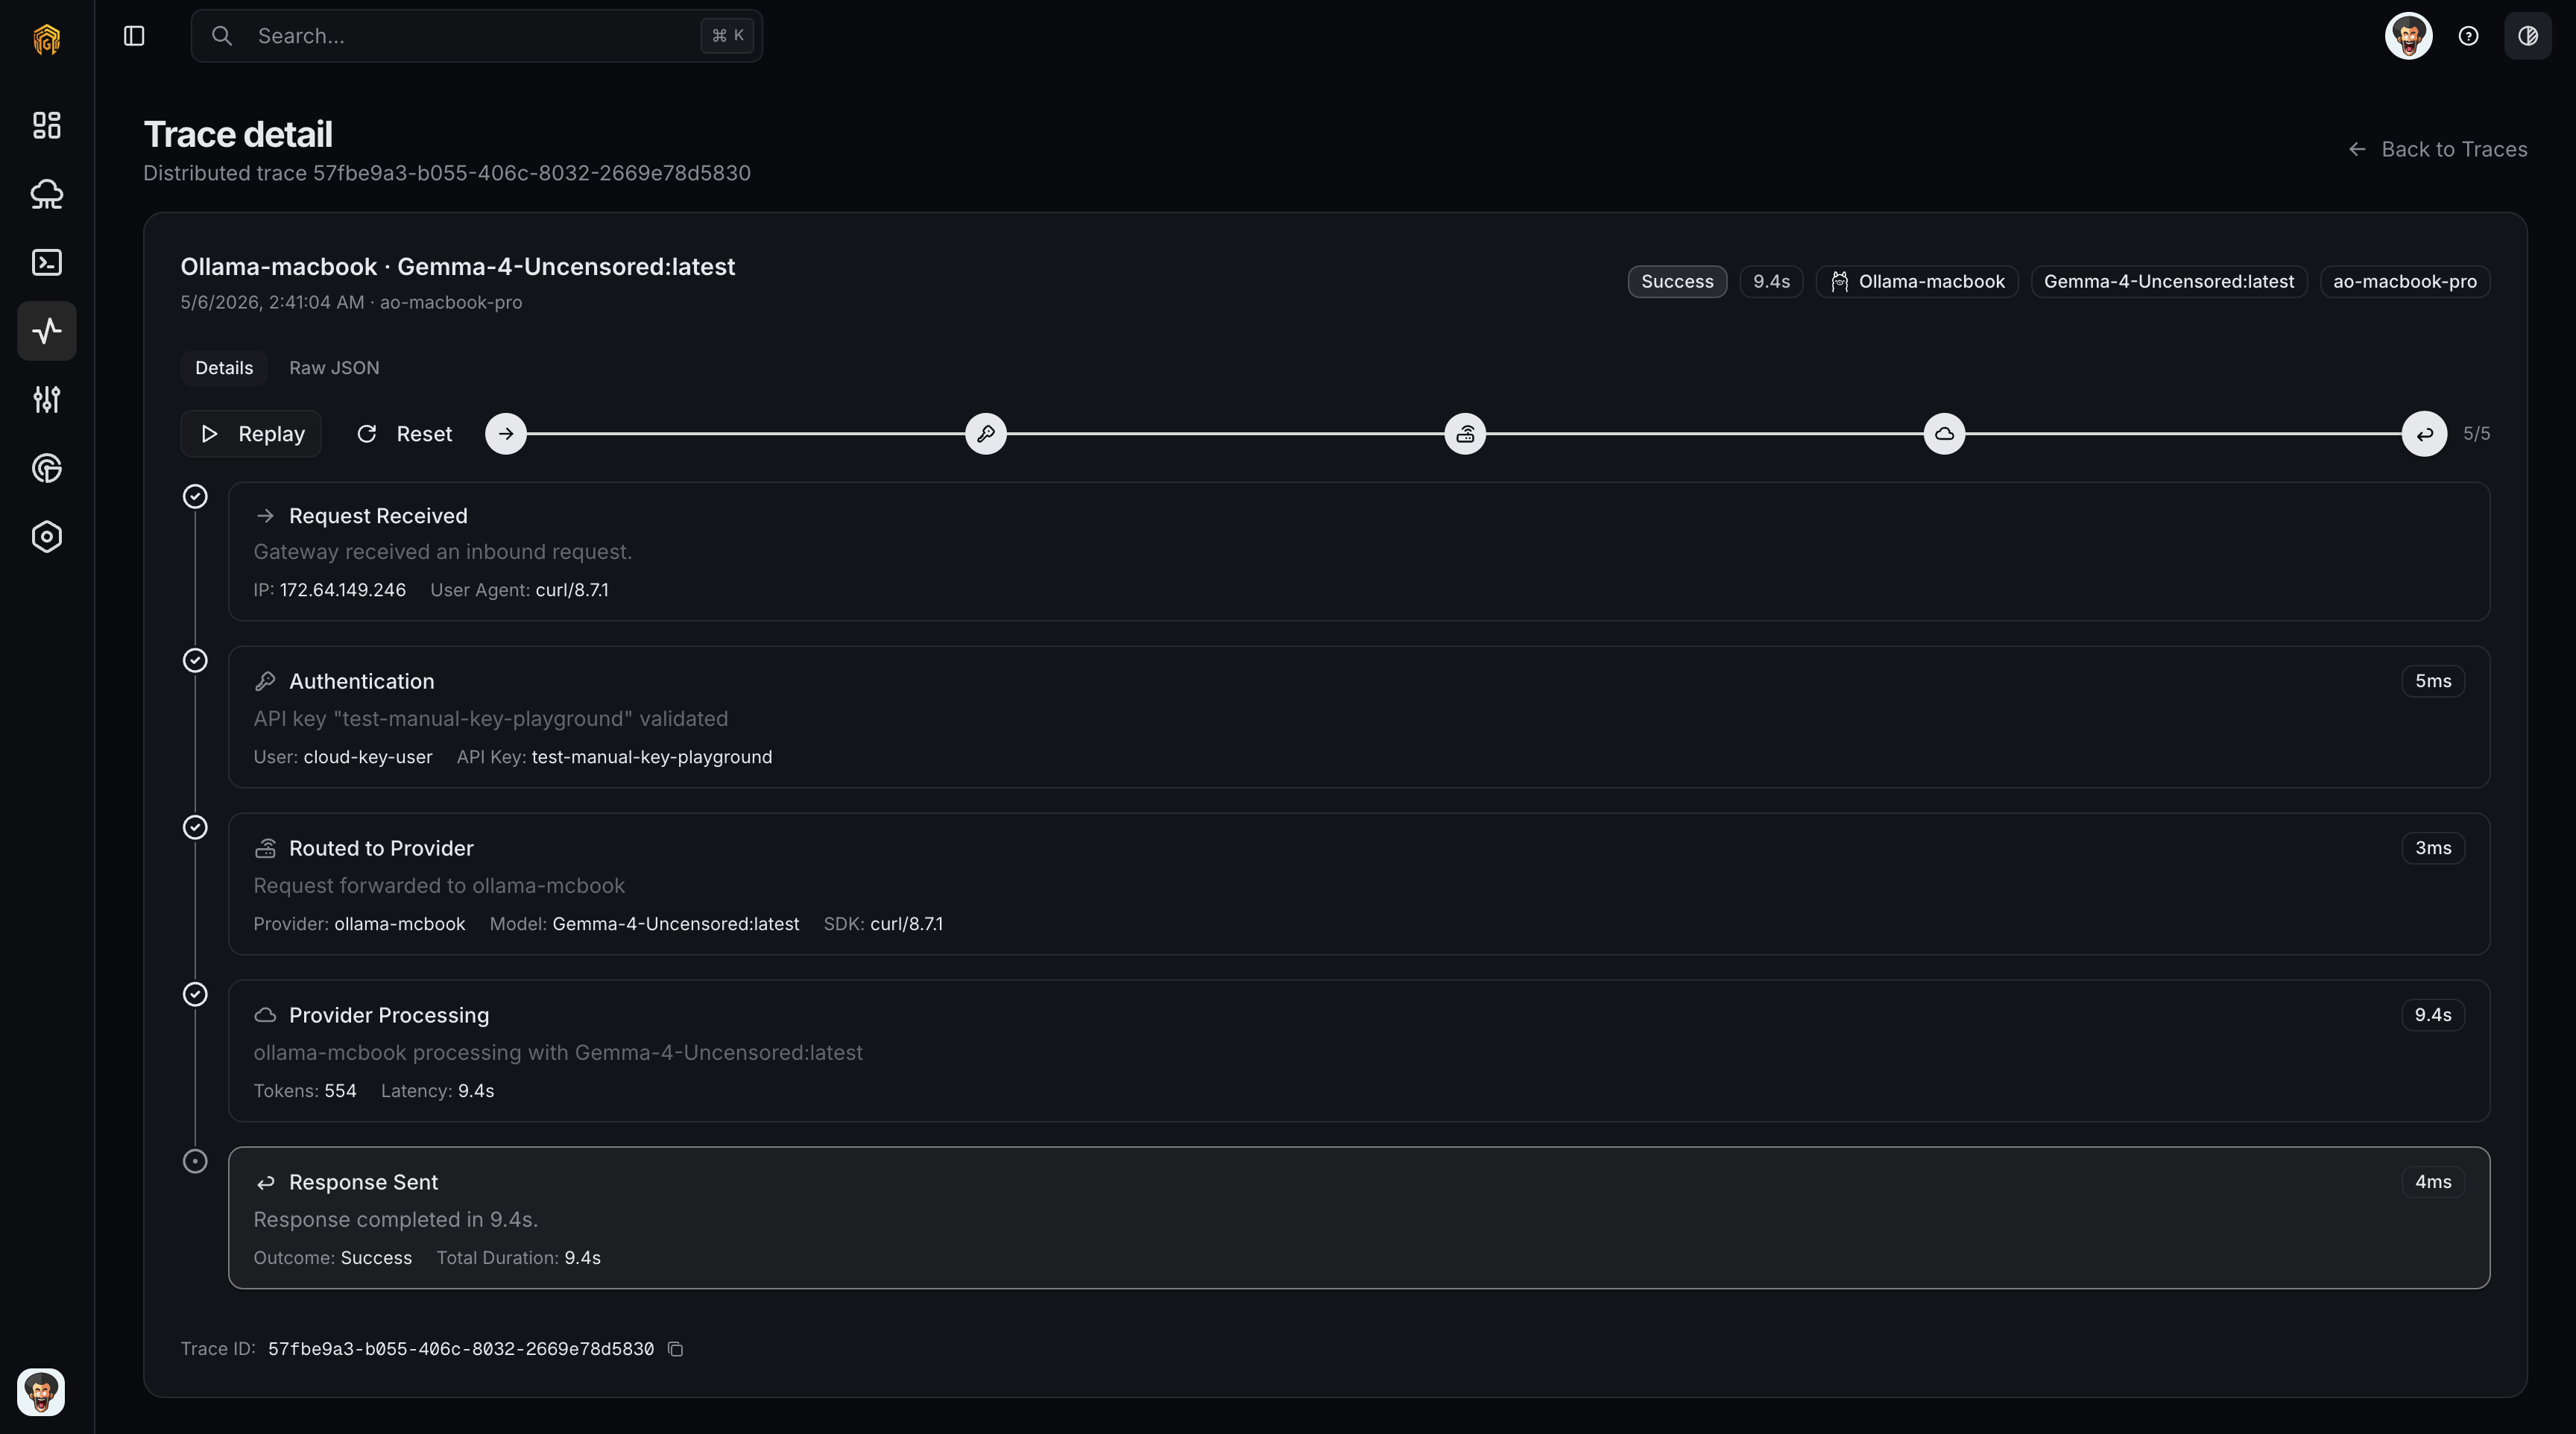
Traces
A trace is a timeline of the steps a request went through inside the gateway. Each step has an icon:| Icon | Step |
|---|---|
| Shield | Guardrail evaluation (PII, hate speech, prompt injection, keyword, IP). |
| Key | Authentication and quota check. |
| Router | Routing rule match + provider selection. |
| Cloud | Upstream model call. |
| Cache | Cache hit or miss. |
How to configure
There is no configuration on this page itself — Logs is read-only. To change what gets captured:Add or rotate API keys
Configuration → API Keys determines which key labels show up in the API Key filter.
Tune guardrails
Configuration → Security controls what shows up in the Guardrails tab.
Adjust retention
Log retention is set per gateway in the gateway environment. See Environment.
Exports
From any tab, click Export to download the current filter as CSV or JSON. Exports are assembled locally on the gateway; the dashboard only forwards the query.Related
- Audit log — administrative actions, recorded centrally on the platform.
- Configuration → Security — rules whose triggers show up in the Guardrails tab.
- Notifications — push these events to webhooks.