

What this is for
Once you’ve completed Deploy and started the gateway container, this page tells you what success should look like in the dashboard. If everything on this page checks out, the gateway is fully activated and ready to serve requests.Step 1 — Watch the status pill flip
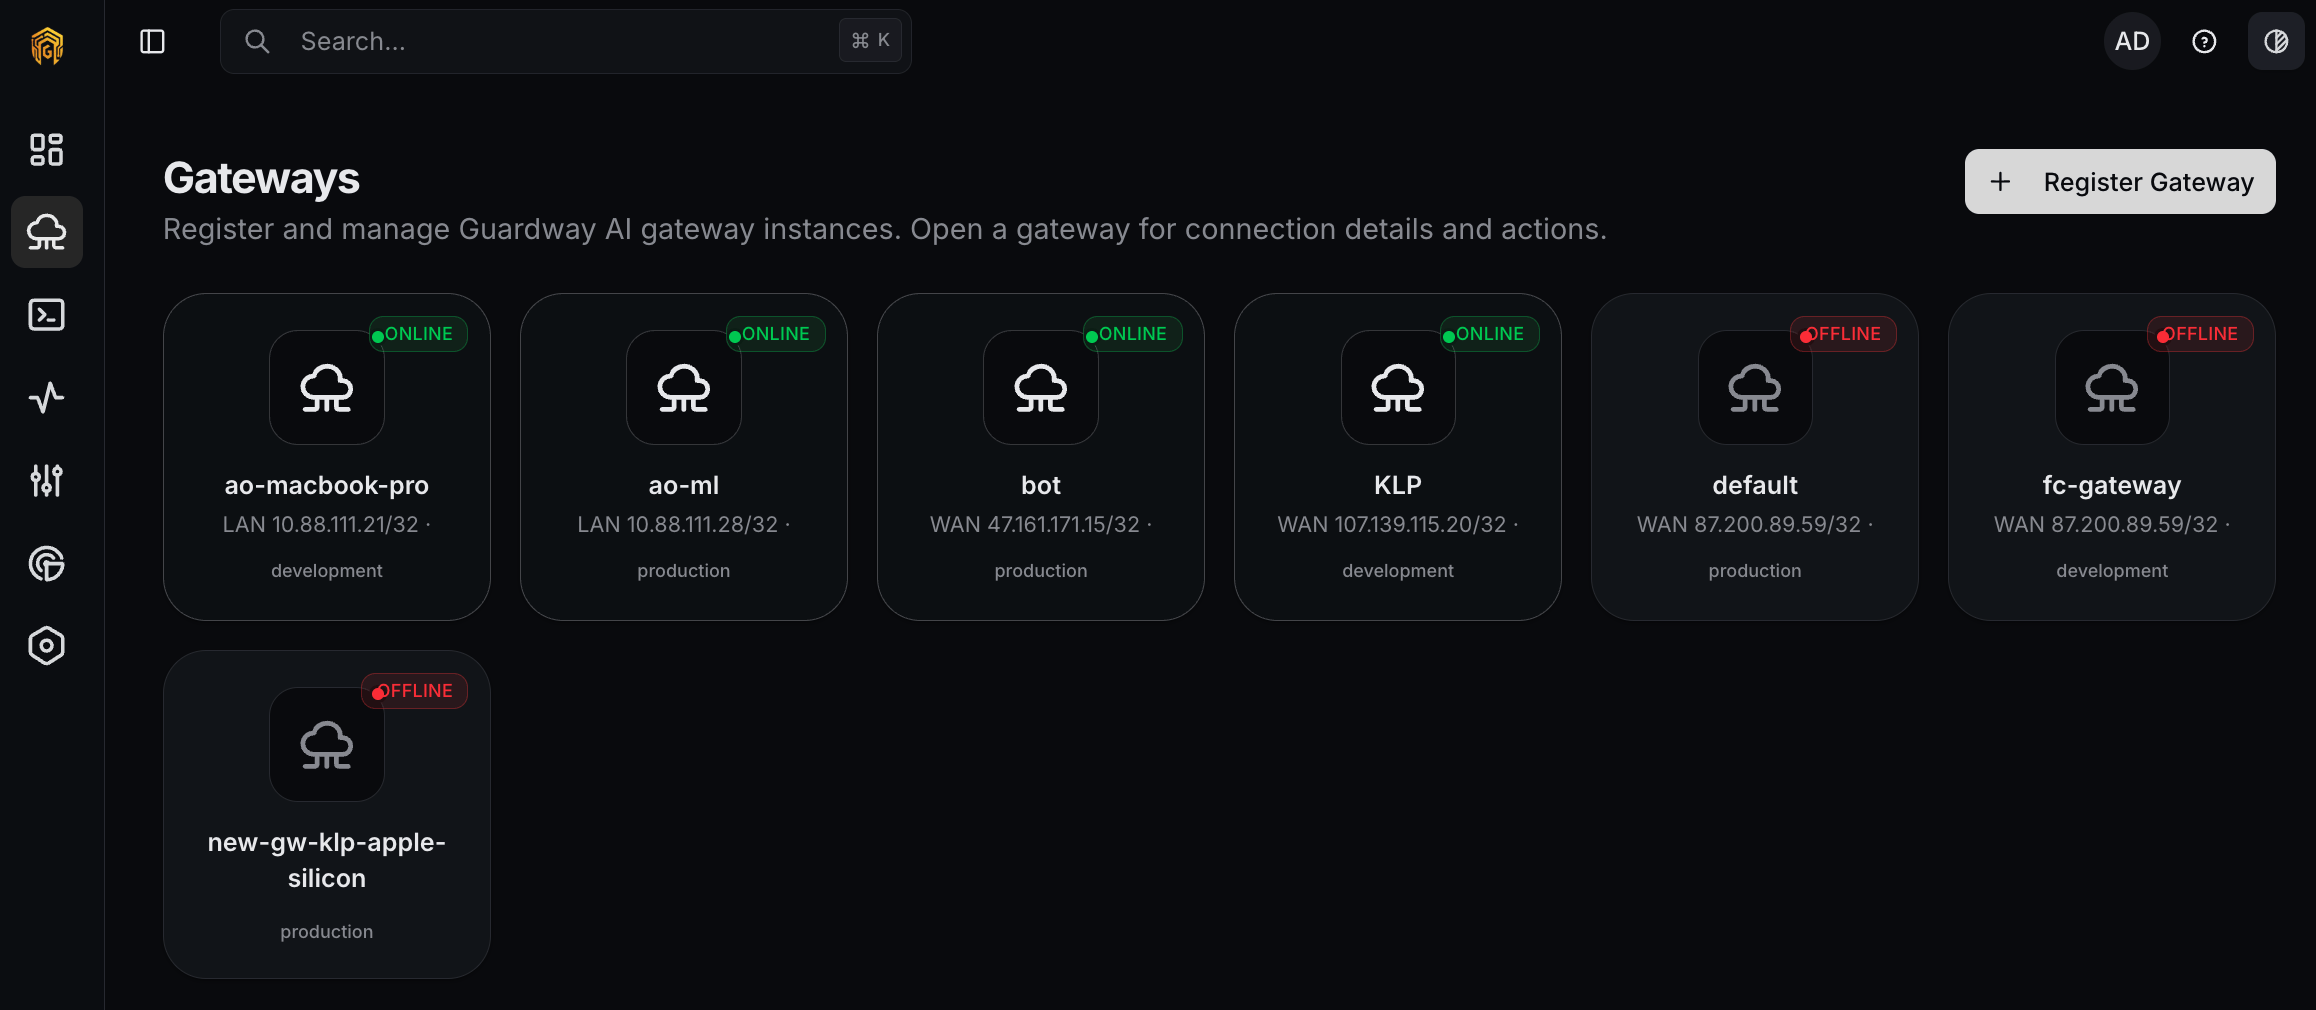
Open the Gateways page from the dashboard sidebar. Within ~60 seconds ofdocker compose up -d, a row appears for the new gateway with one of these pills:
The pill flips to Healthy the moment the first successful heartbeat lands — by default that’s
GUARDWAY_HEARTBEAT_INTERVAL (60s) after startup. See Environment to tune the interval.
Step 2 — Inspect the gateway detail
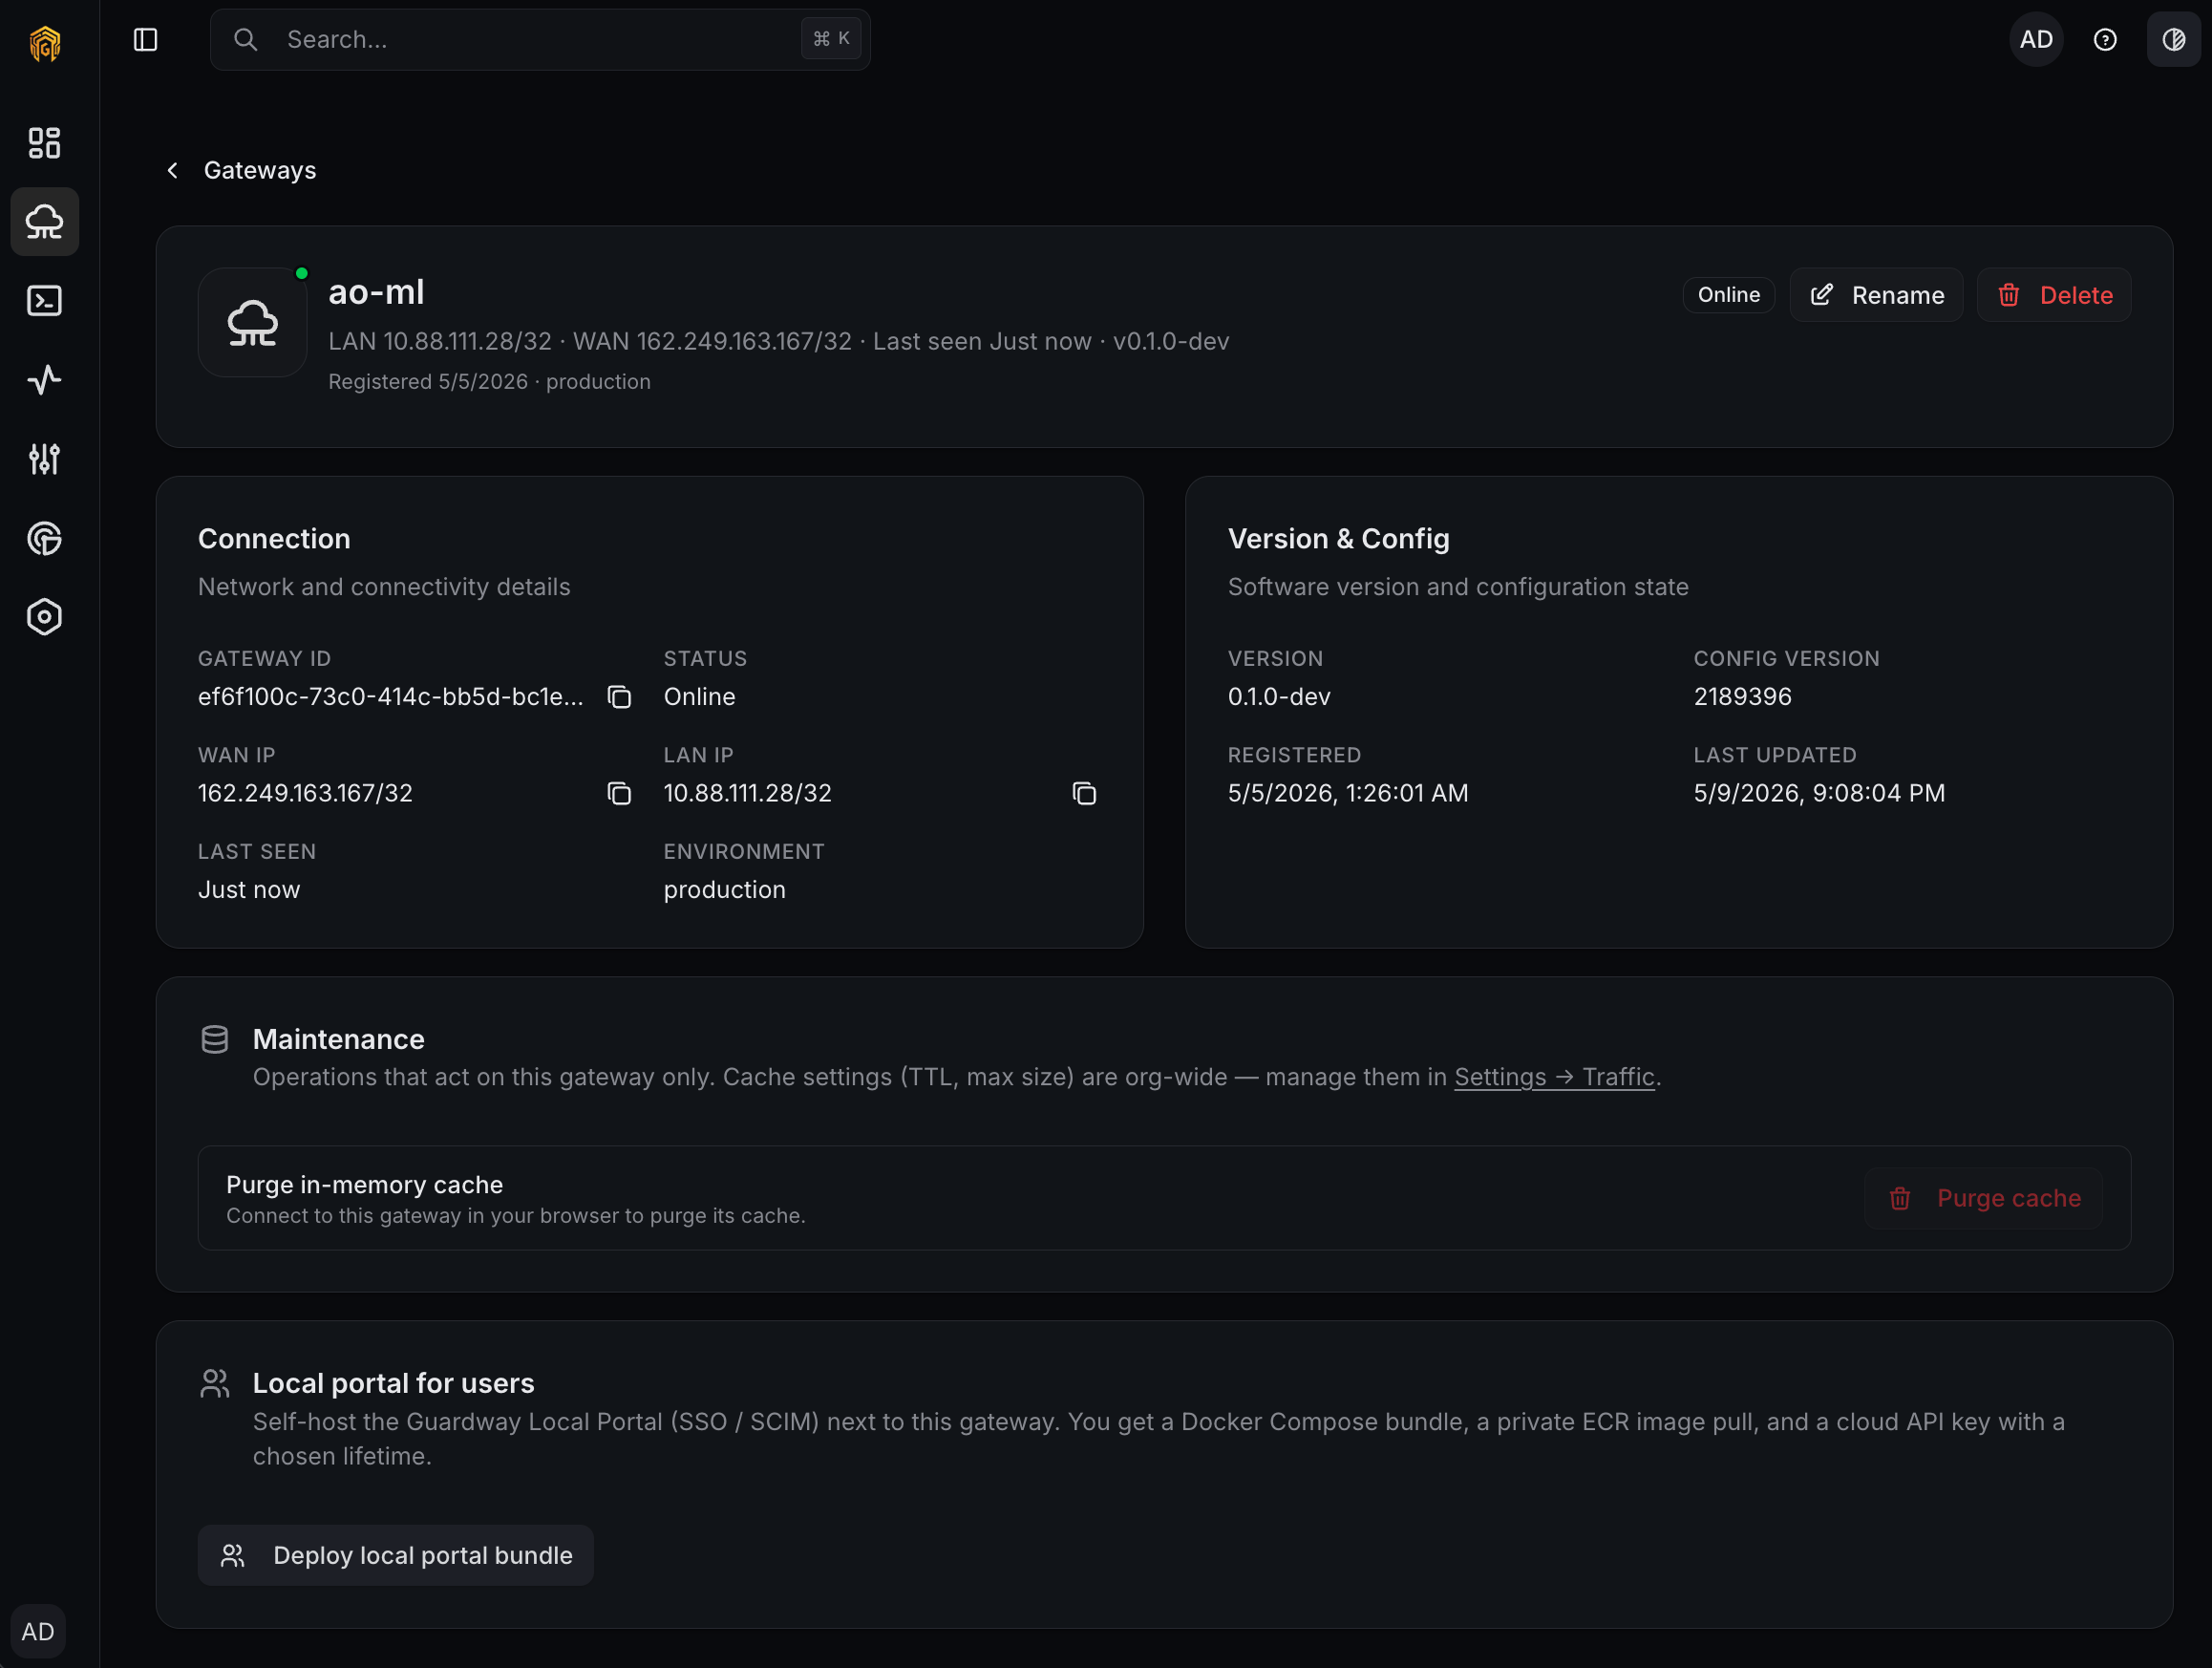
Click the gateway row to open its detail page. This view is your post-activation control panel for that specific gateway:- Connection — Gateway ID, Status, WAN IP, LAN IP, Last Seen, Environment.
- Version & Config — running gateway version, config revision, registration timestamp, last config update.
- Maintenance — gateway-only operations like Purge in-memory cache. Org-wide cache settings (TTL, max size) live on Settings → Traffic.
- Local portal for users — Deploy local portal bundle generates a Docker Compose bundle for a self-hosted Guardway Local Portal (SSO/SCIM) that pairs with this gateway.
- Header actions — Rename updates the dashboard label; Delete removes the gateway and revokes its credentials.
Step 3 — Send the first request
Open Playground, pick the new gateway, choose any model that’s already exposed, and send a short prompt. The first request through the gateway proves end-to-end connectivity:- The dashboard reaches the gateway’s local URL.
- The gateway authenticates the request, applies any guardrails and routing, and forwards to the upstream provider.
- The response streams back to Playground, and a row appears under Logs.
Step 4 — Confirm aggregate signals
Within a few minutes, the dashboard’s main views start showing the new gateway:- Dashboard → Overview — request counters tick up.
- Dashboard → Usage — token totals appear for the request you just sent.
- Logs — the request you sent in Step 2 is visible with prompt, completion, latency, and any guardrail decisions.
Troubleshooting
Stuck on Pending for more than a minute
Stuck on Pending for more than a minute
Run
docker logs guardway-gateway. The most common causes are outbound HTTPS blocked by a corporate proxy/firewall, system clock skew breaking JWT validation, or a registration token that was already consumed. See Deploy → Troubleshooting.Healthy in dashboard but Playground says it can't reach the gateway
Healthy in dashboard but Playground says it can't reach the gateway
The dashboard reaches the gateway over its local URL (the LAN/host address from
GUARDWAY_LOCAL_IP or whatever you connect with). The control-plane heartbeat going through doesn’t prove that path is reachable. Confirm the host running your browser can reach the gateway on TCP 8080.First request returns 401
First request returns 401
The dashboard authenticates to the gateway with a per-session JWT derived from your Supabase token. If you signed in to the dashboard before registering the gateway, sign out and back in to refresh the session.
Force re-activation
Force re-activation
Stop the container, delete the credentials file (default
/etc/guardway/credentials.json), generate a new registration token from the dashboard, and run docker compose up -d again. The gateway re-registers as if it were a fresh install.Related
- Deploy — the Register Gateway dialog walkthrough.
- Environment — every env var the gateway reads.
- Playground — the fastest way to send a first request.
- Logs — confirm the first request appears.