

What this is for
Dashboard → Spend is the cost-focused companion to Usage. It rolls up estimated USD across every gateway and pivots by team, key, provider, or model so you can answer “where is the bill coming from” without pulling a finance export. Provider pricing comes from the model inventory (Models); rows where pricing is unknown show as blank input/output cost.Options
Time range
Last Hour, Last 24 Hours, Last 7 Days, Last 30 Days.
Filters
- Gateway — multi-select.
- Provider — multi-select.
- API Key — multi-select.
Breakdowns
Budgets
Team-level monthly spend caps come from the Monthly Spend Limit field on Configuration → Access → Teams. The progress bar on each team row is green under 70%, yellow 70–89%, and red ≥90%.How to configure
This is a read-only analytics view — set budgets, alerts, and per-key caps elsewhere.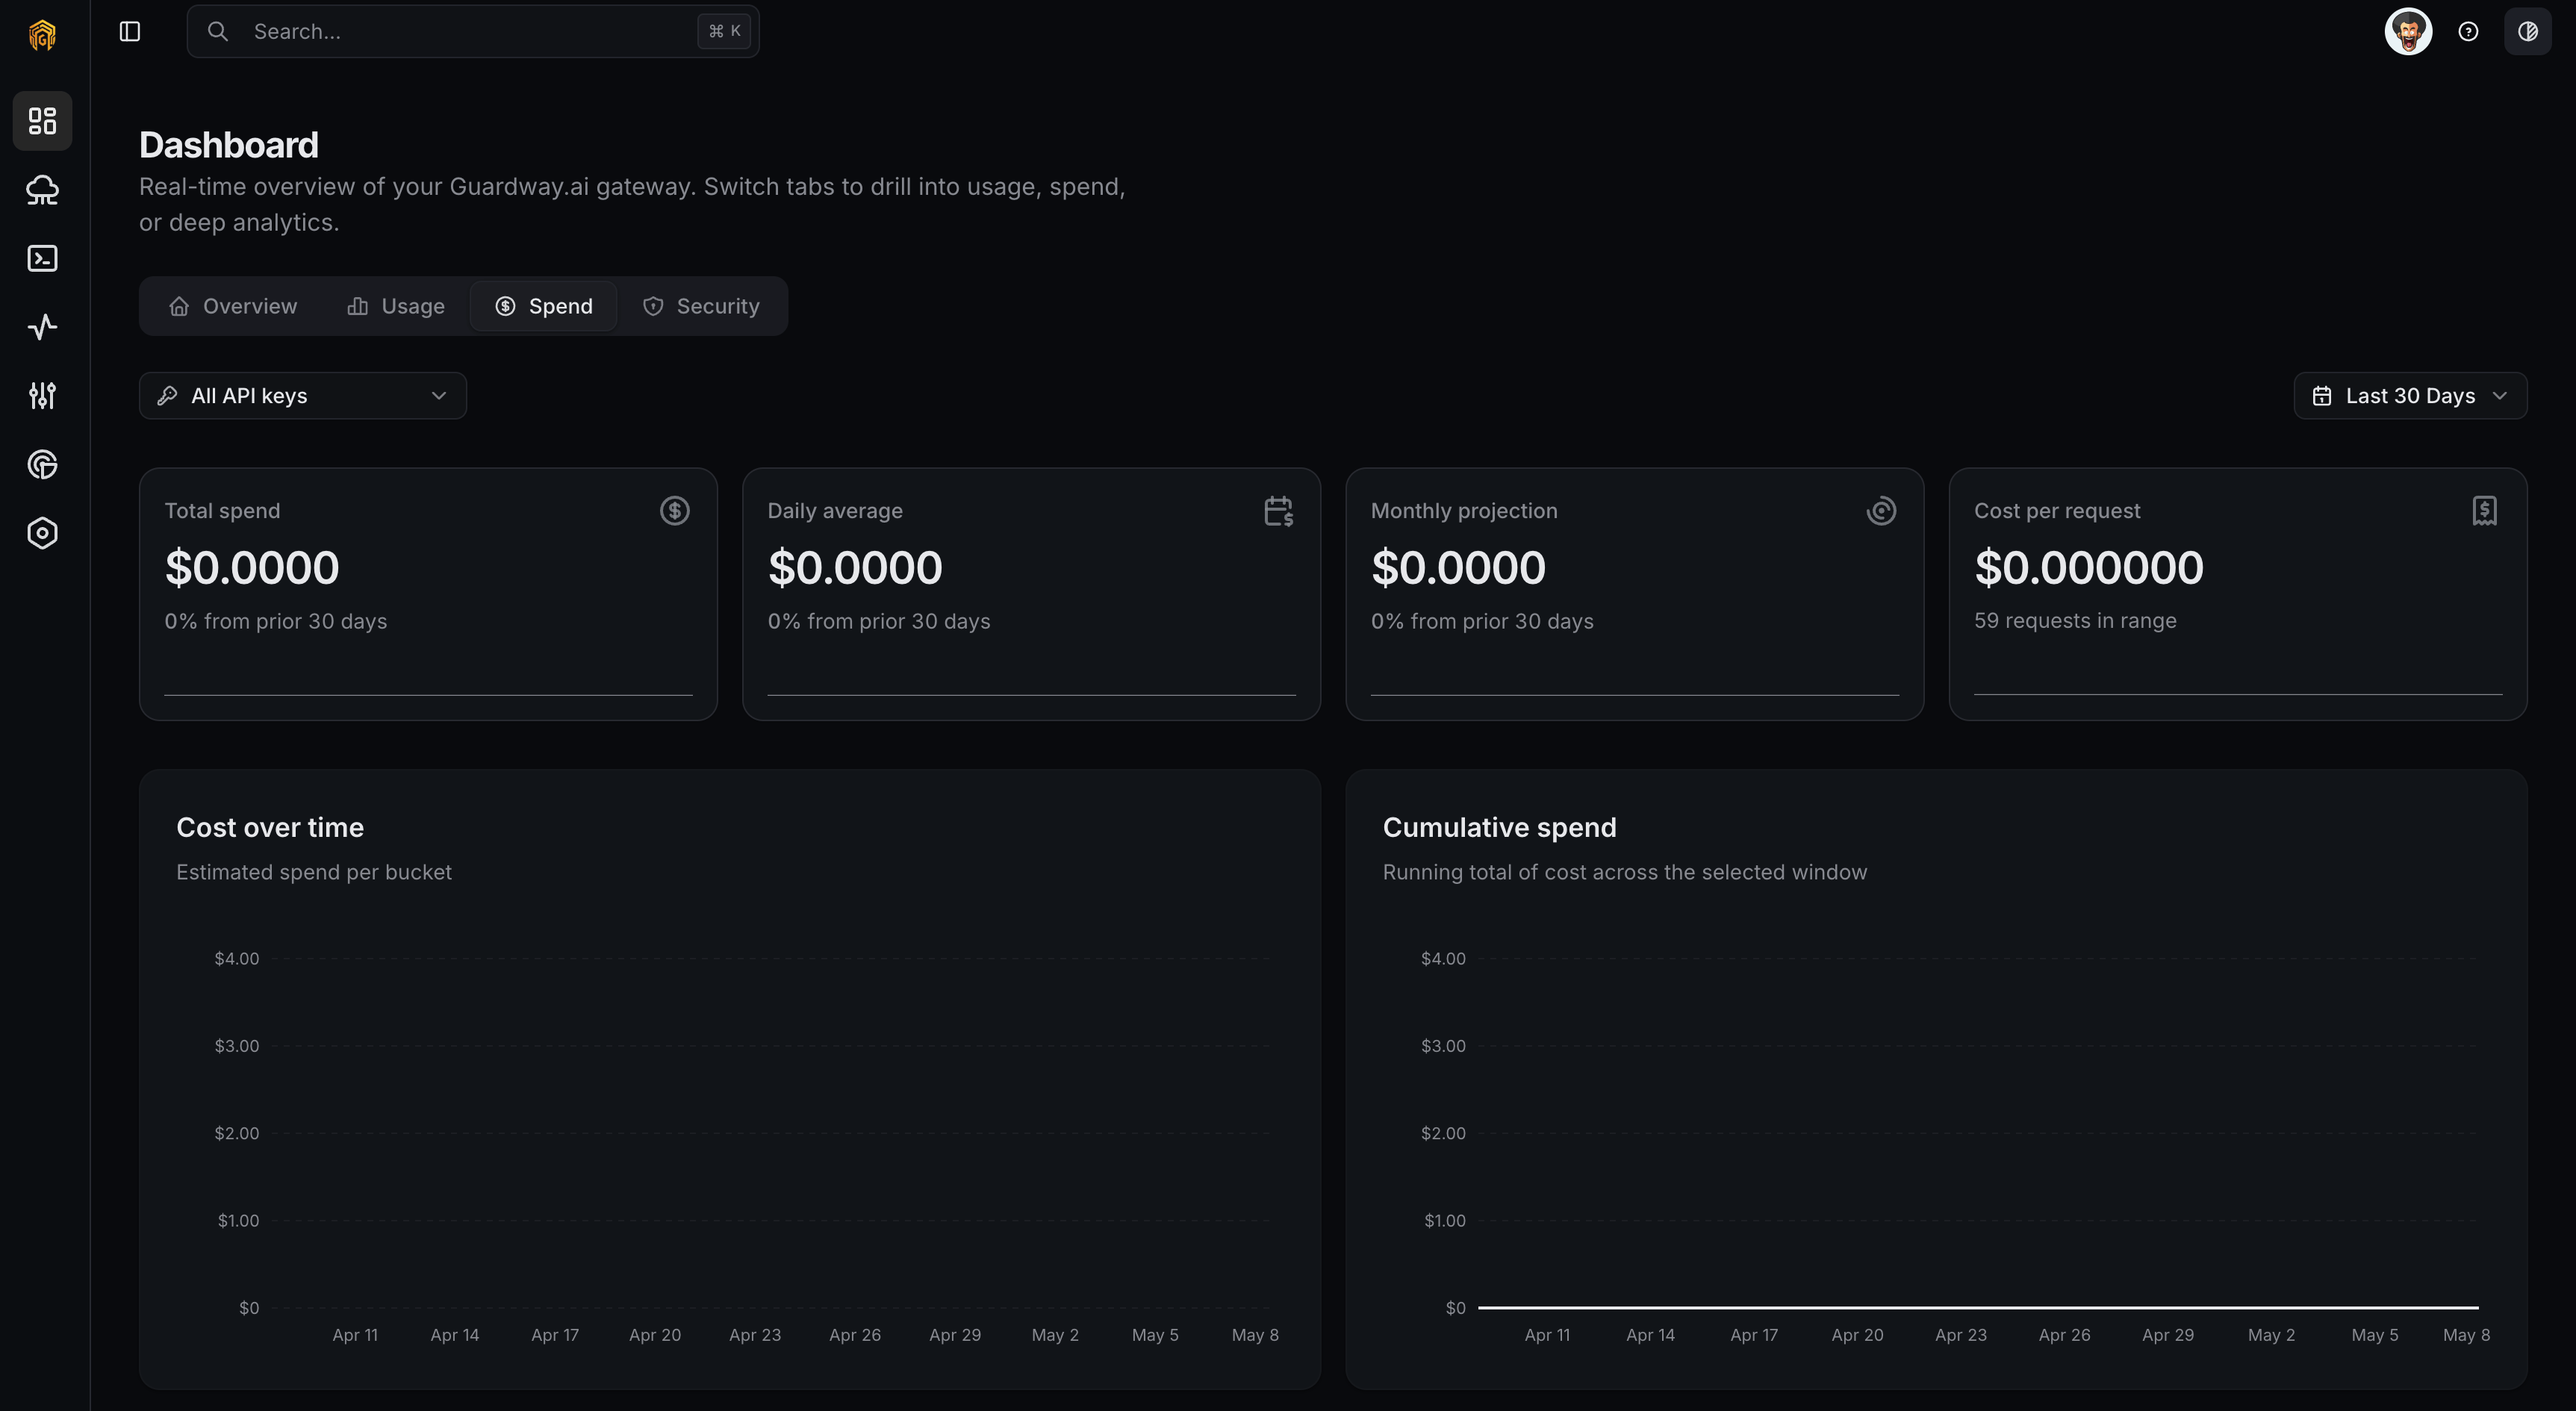
Dashboard → Spend
1
Open Dashboard → Spend
Open Dashboard → Overview from the dashboard sidebar and click the Spend tab.
2
Pick a window and filters
Set Time range, then narrow by Gateway, Provider, or API Key.
3
Pivot the table
Switch the Group by selector between team, API key, provider, model, and gateway to find the dimension that explains the cost.
4
Export
Click Export to download CSV or JSON for finance or a showback system.
5
Set thresholds
To get notified when spend crosses a threshold, configure budgets on API Keys or teams on Members, and add an alert rule on Notifications.
Related
- Usage — request/token view of the same telemetry.
- API Keys — per-key budget and alert thresholds.
- Members — per-team monthly spend limits.
- Notifications — fire on
quota.thresholdandquota.exceeded.