> ## Documentation Index
> Fetch the complete documentation index at: https://docs.guardway.ai/llms.txt
> Use this file to discover all available pages before exploring further.
# Logs
> Inspect every request, MCP tool call, guardrail trigger, and trace through the gateway.
## What this is for
The **Logs** page is the operational view of traffic flowing through your gateway. It captures four complementary perspectives, organized as tabs:
* **Requests** — flat, filterable table of every HTTP request the gateway served.
* **MCP** — every tool call made through an MCP server attached to the gateway.
* **Guardrails** — every guardrail rule trigger (input or output, blocked or logged).
* **Traces** — OpenTelemetry timelines showing how each request flowed through guardrails, auth, routing, cache, and the upstream provider.
Request, MCP, guardrail, and trace logs are recorded **on the gateway**. Viewing them requires the dashboard to be connected to that gateway — see [Activation](/guardway-gateway/activate). Administrative audit logs live on the platform — see [Audit Log](/platform/settings/audit-log).
## Requests
The default tab. A flat table of every HTTP request, sortable on any column.
### Columns
Timestamp, method, path, status, duration, provider, model, API key name, tokens (prompt + completion), cost, client IP, and trace ID.
### Filters
| Filter | Notes |
| ---------- | ------------------------------------------------ |
| Time range | Presets (1h, 24h, 7d, 30d) or a custom calendar. |
| Gateway | Multi-select. Leave empty for all gateways. |
| Provider | Multi-select. |
| API Key | Multi-select. |
| Search | Matches request path, model, or API key name. |
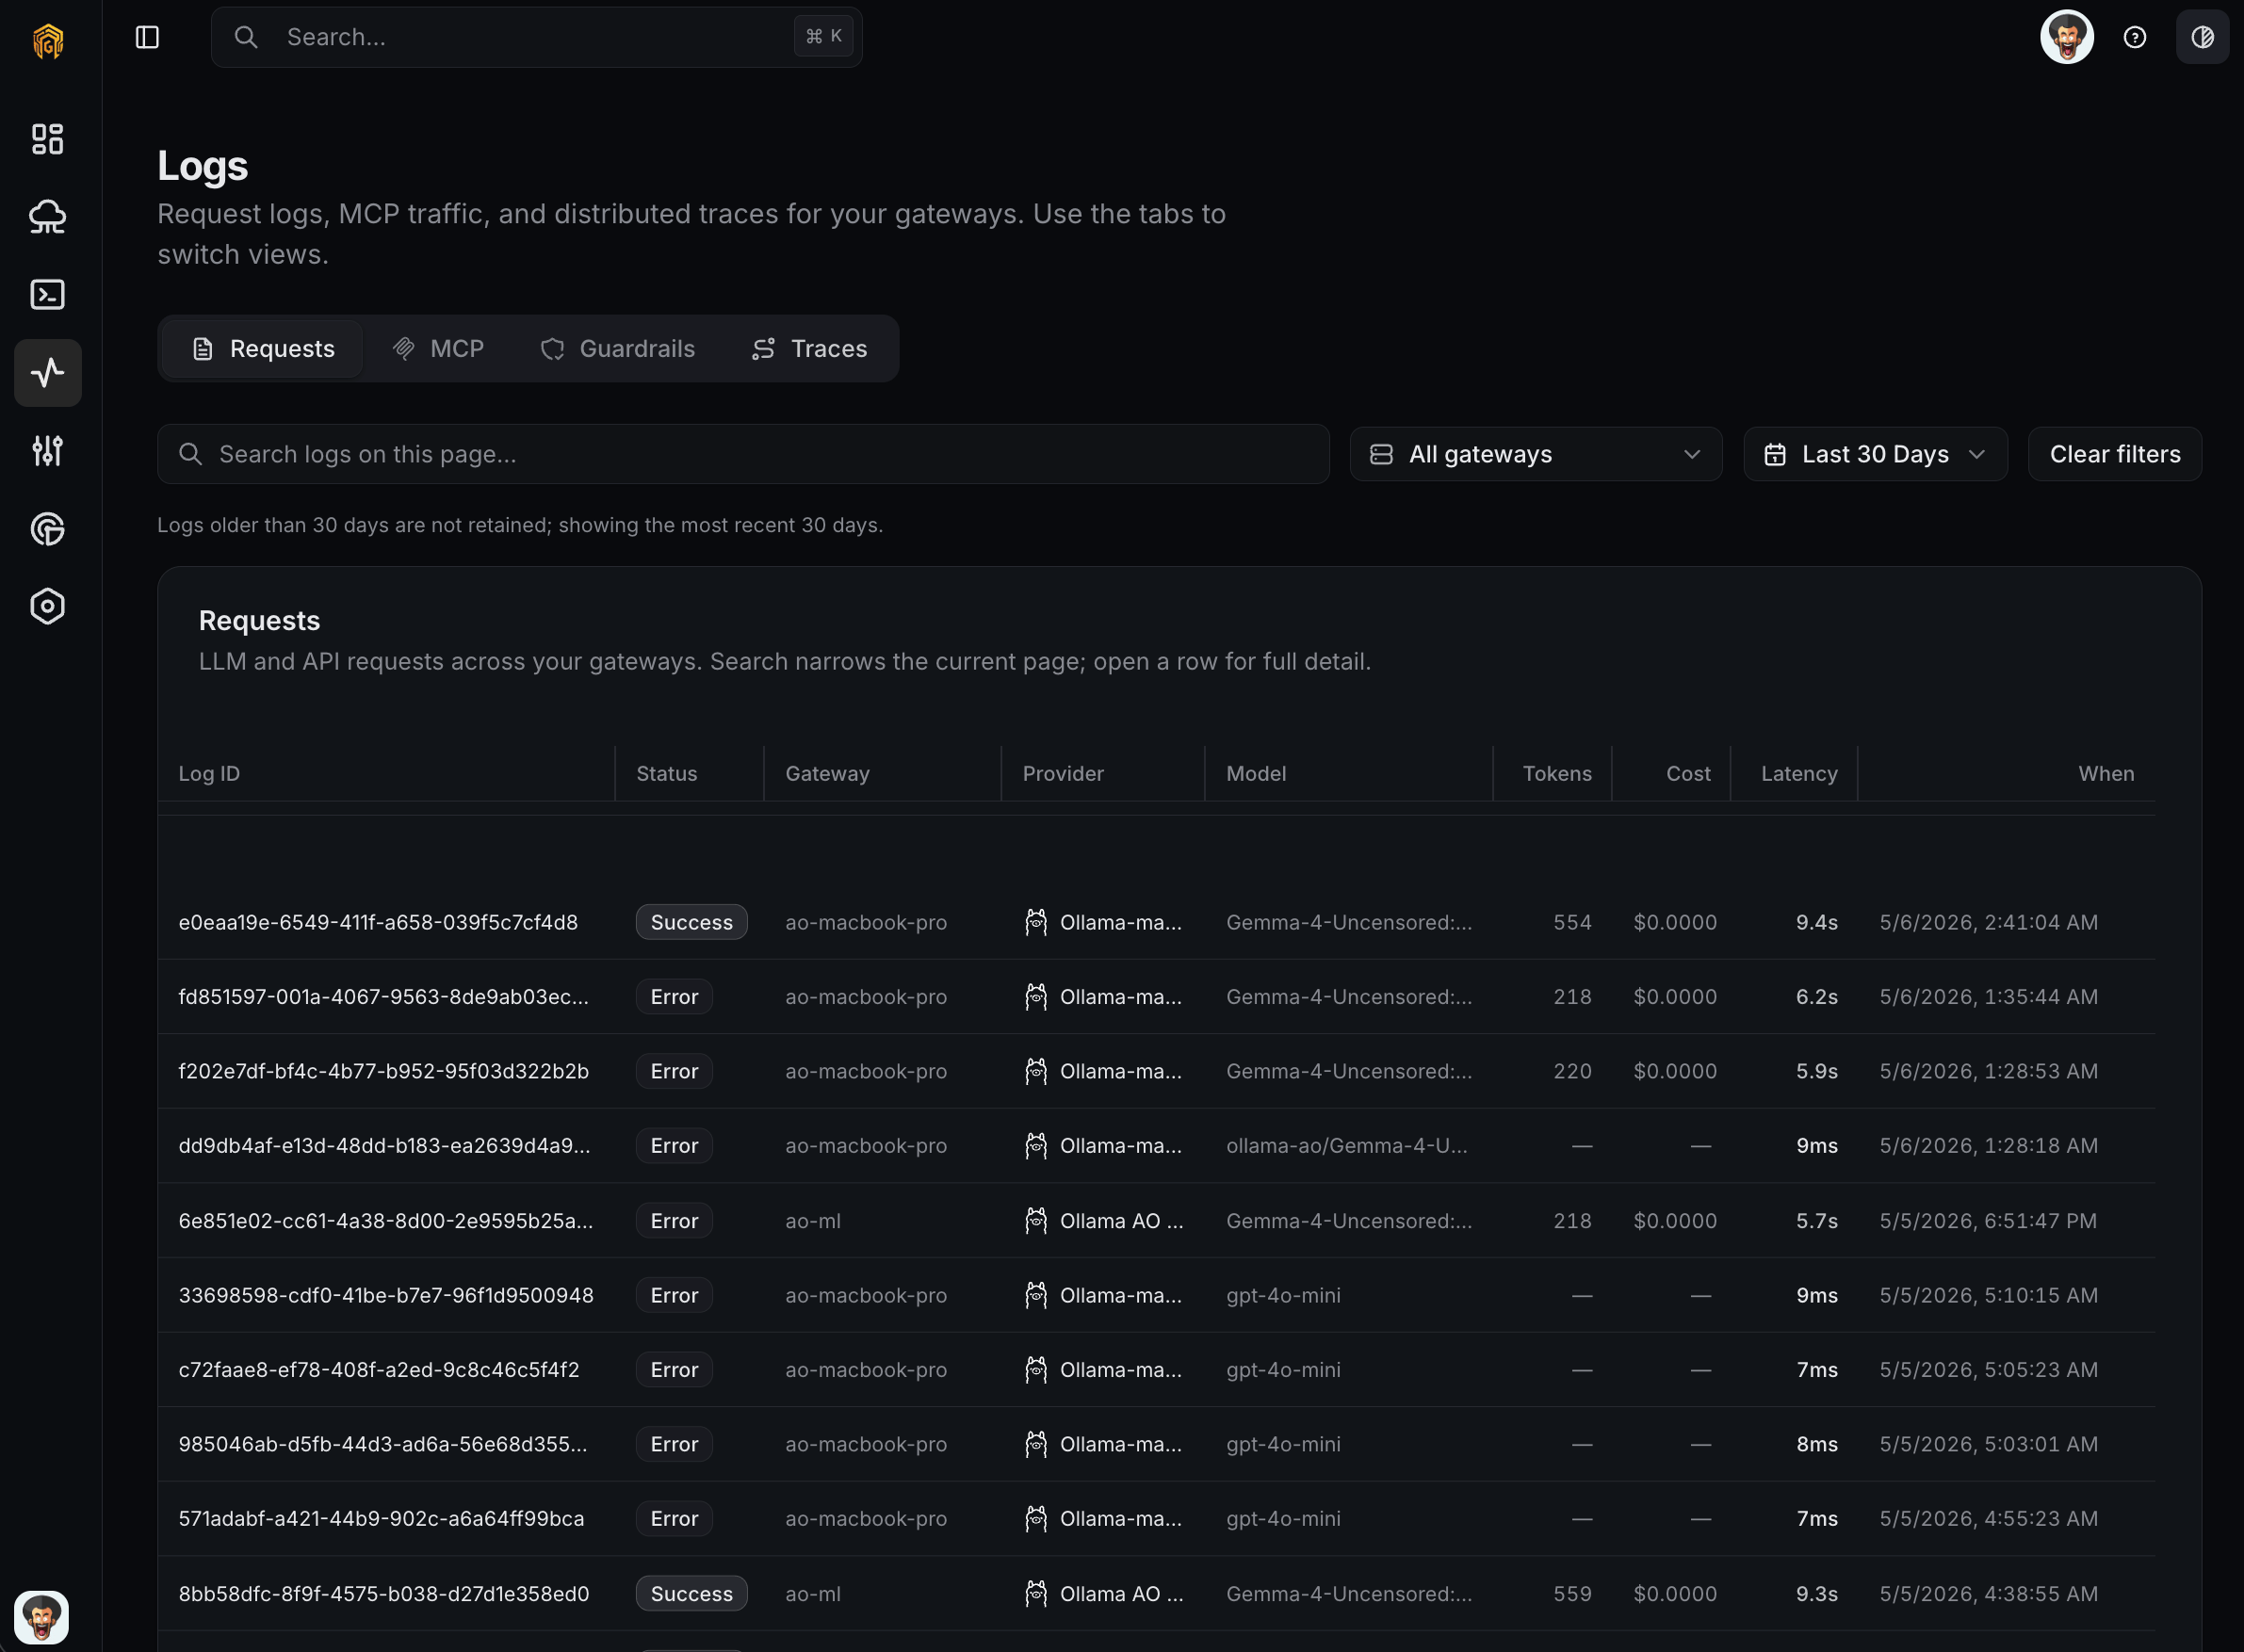 Click a row's **trace ID** to jump straight to the matching trace.
## MCP
Every call to a tool exposed by an MCP server registered with the gateway is logged here.
| Column | Notes |
| ------------------ | ------------------------------------------------------------- |
| Timestamp | When the call was made. |
| MCP server | The server that handled the call. |
| Tool | The tool name. |
| Caller | The API key or session that invoked the tool. |
| Status | `ok`, `error`, or `denied` (blocked by MCP scope on the key). |
| Duration | Round-trip time. |
| Request / Response | JSON payload, viewable inline. |
Filters mirror Requests: time range, gateway, and a free-text search that matches tool name, MCP server, or API key name.
Click a row's **trace ID** to jump straight to the matching trace.
## MCP
Every call to a tool exposed by an MCP server registered with the gateway is logged here.
| Column | Notes |
| ------------------ | ------------------------------------------------------------- |
| Timestamp | When the call was made. |
| MCP server | The server that handled the call. |
| Tool | The tool name. |
| Caller | The API key or session that invoked the tool. |
| Status | `ok`, `error`, or `denied` (blocked by MCP scope on the key). |
| Duration | Round-trip time. |
| Request / Response | JSON payload, viewable inline. |
Filters mirror Requests: time range, gateway, and a free-text search that matches tool name, MCP server, or API key name.
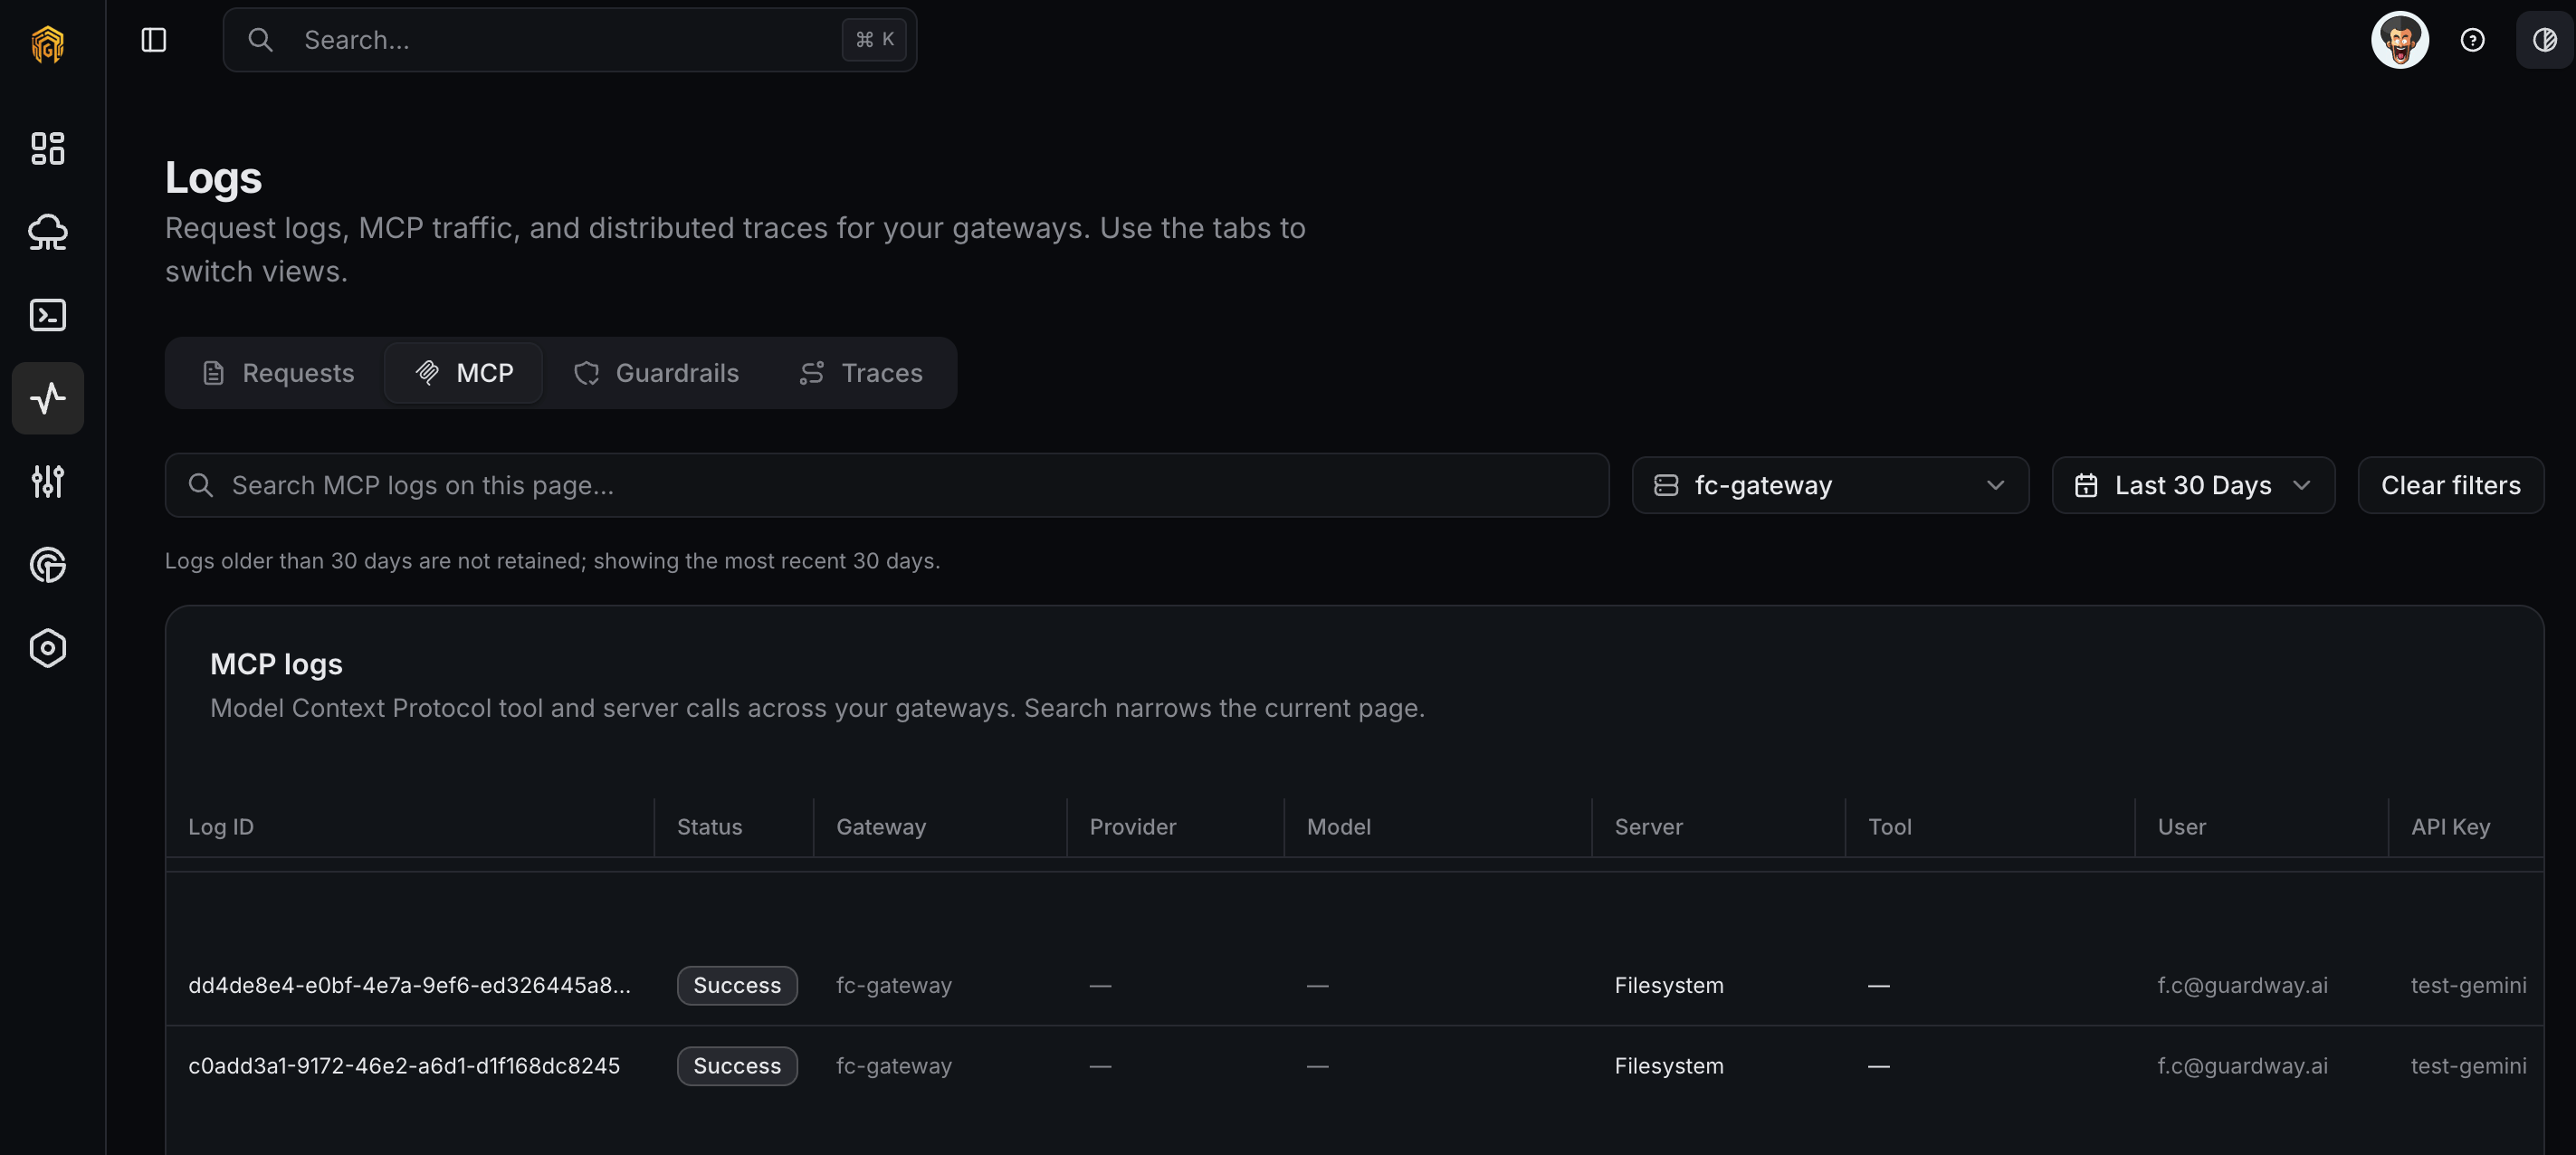 If a call shows **denied**, check the API key's MCP scope on [API Keys](/platform/configuration/api-keys) — the key's allow-list is the usual cause.
## Guardrails
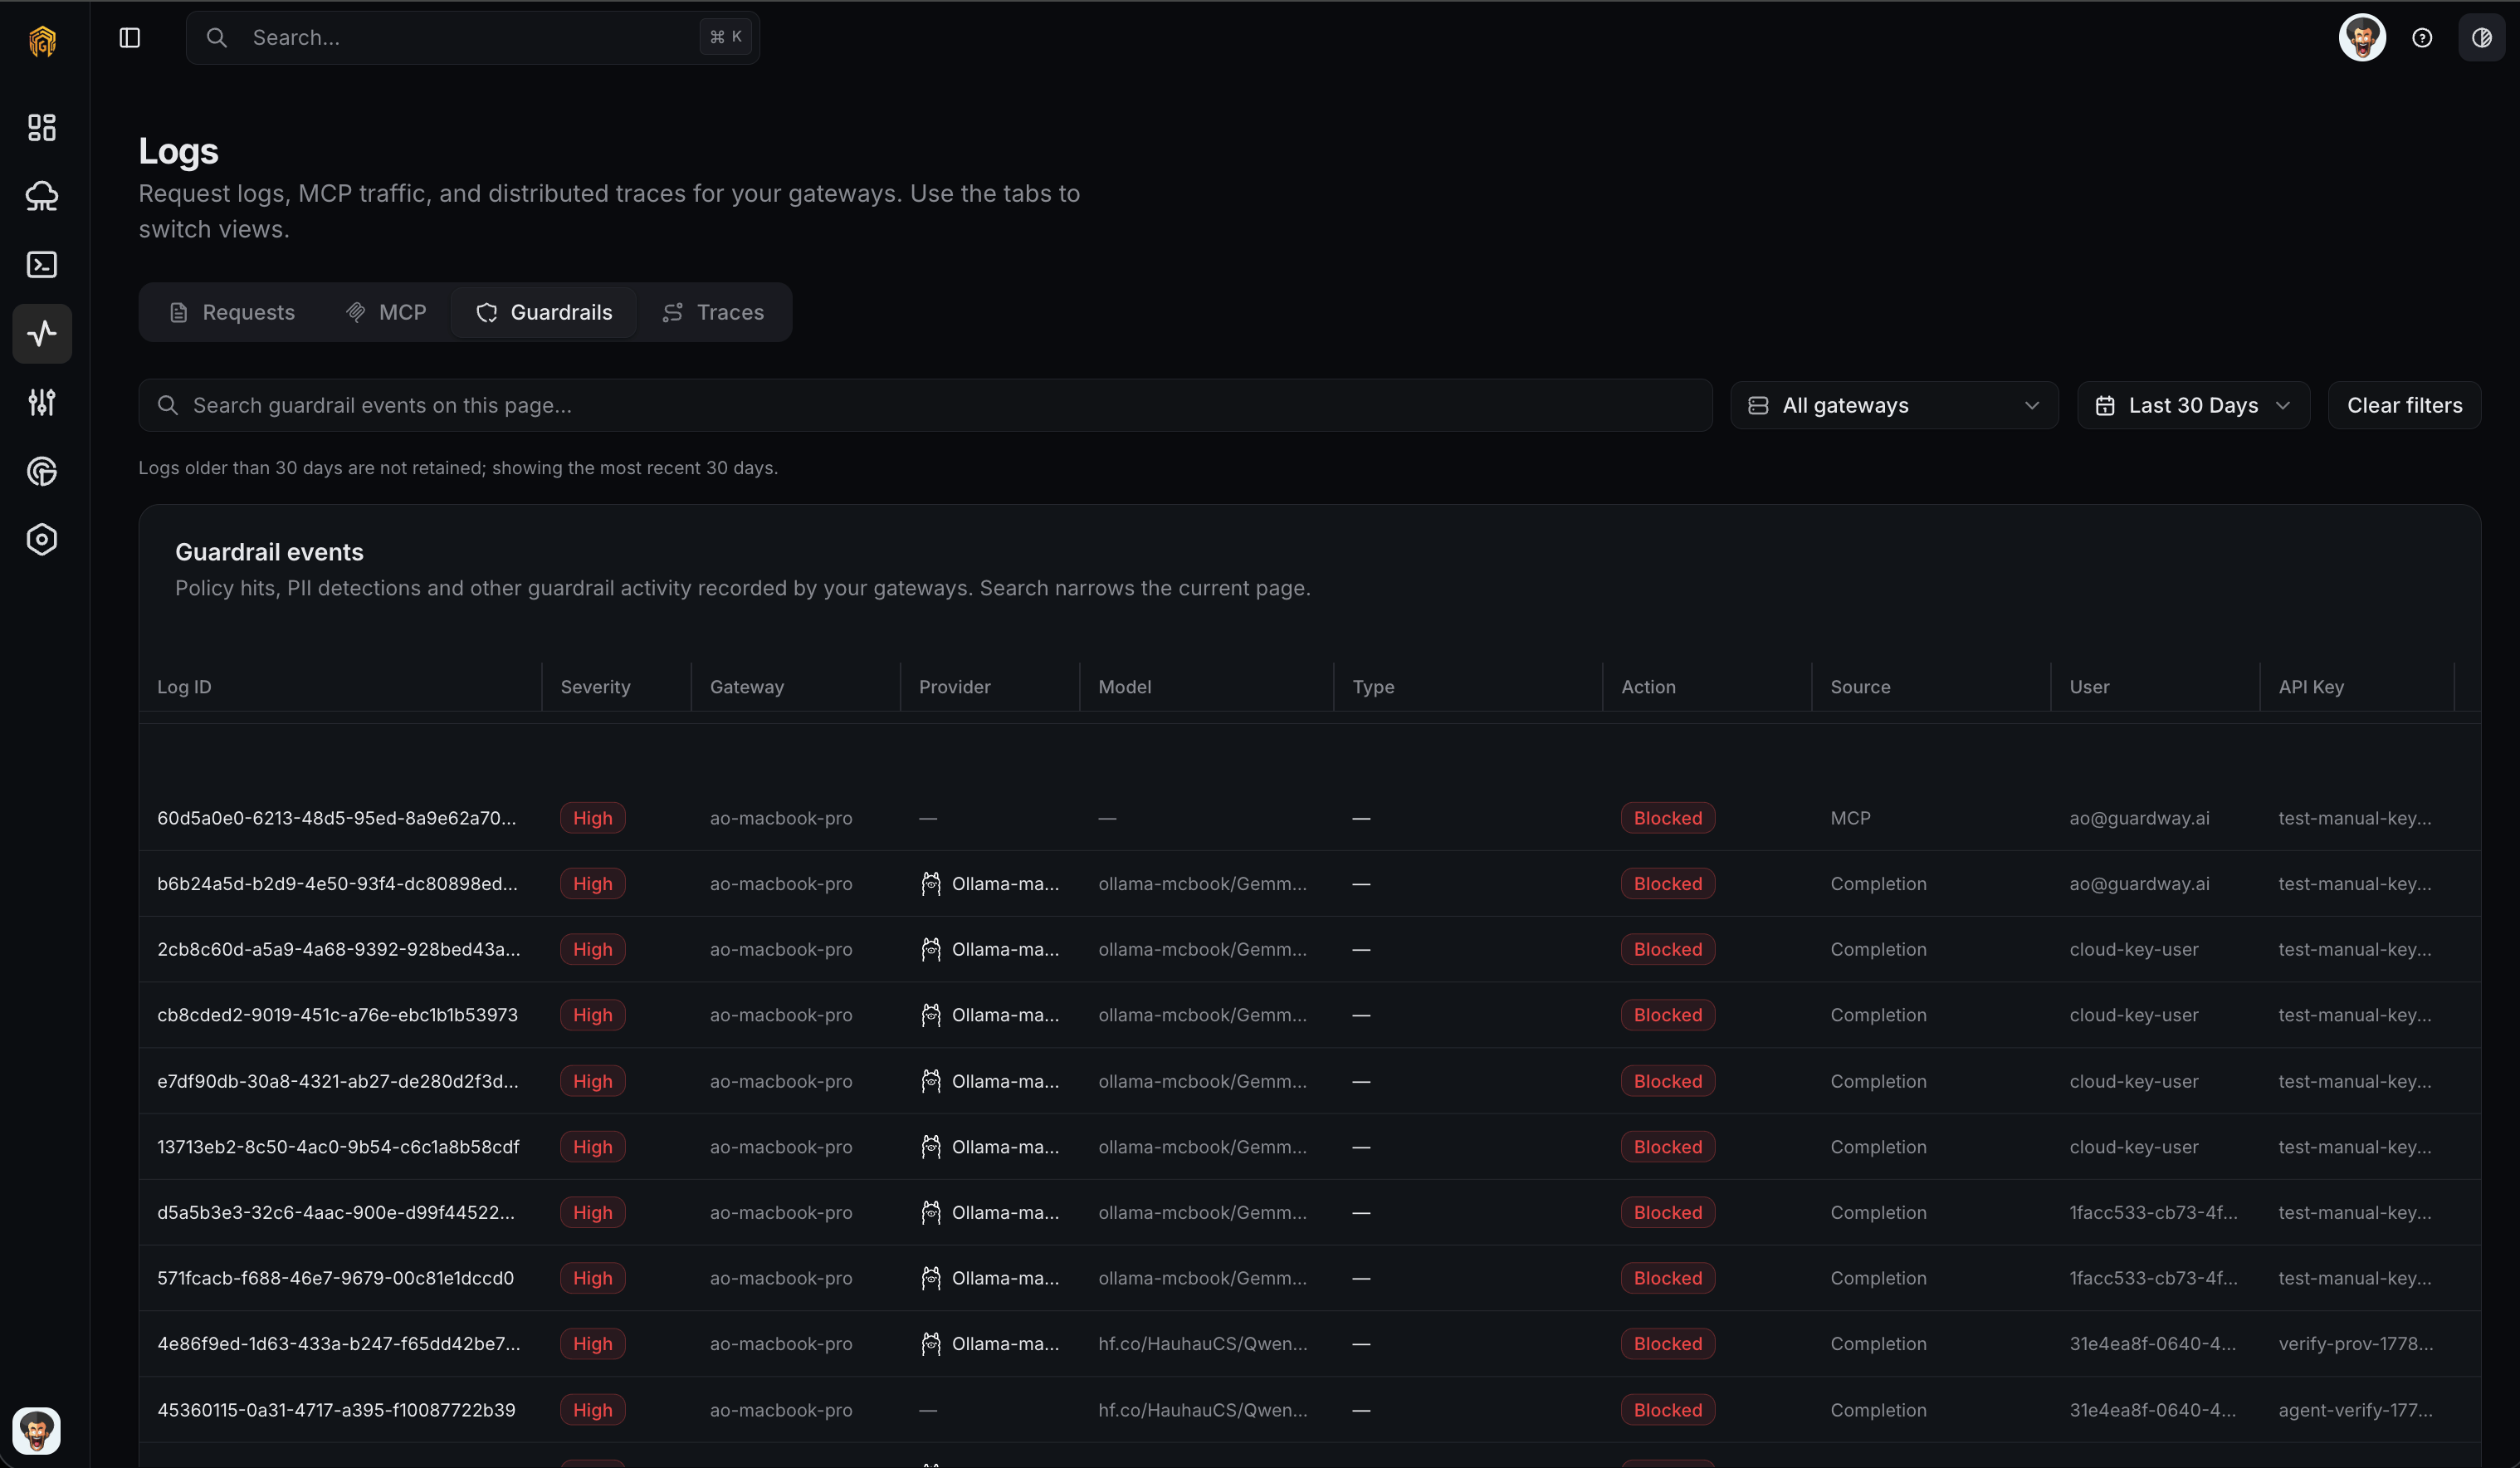
Every guardrail rule trigger — both rule-based ([Guardrails](/platform/configuration/security#guardrails)) and SLM-based ([SLM Guardrails](/platform/configuration/security#slm-guardrails)) — is recorded here. Each row shows the rule name, category, action taken (`block`, `warn`, `redact`, `log`), the matched content (or its hash for redacted entries), and a link back to the originating request.
Use this tab to audit policy hits, tune thresholds before promoting an SLM model to a blocking action, and confirm a rule is matching what you expect.
If a call shows **denied**, check the API key's MCP scope on [API Keys](/platform/configuration/api-keys) — the key's allow-list is the usual cause.
## Guardrails
Every guardrail rule trigger — both rule-based ([Guardrails](/platform/configuration/security#guardrails)) and SLM-based ([SLM Guardrails](/platform/configuration/security#slm-guardrails)) — is recorded here. Each row shows the rule name, category, action taken (`block`, `warn`, `redact`, `log`), the matched content (or its hash for redacted entries), and a link back to the originating request.
Use this tab to audit policy hits, tune thresholds before promoting an SLM model to a blocking action, and confirm a rule is matching what you expect.
 ## Traces
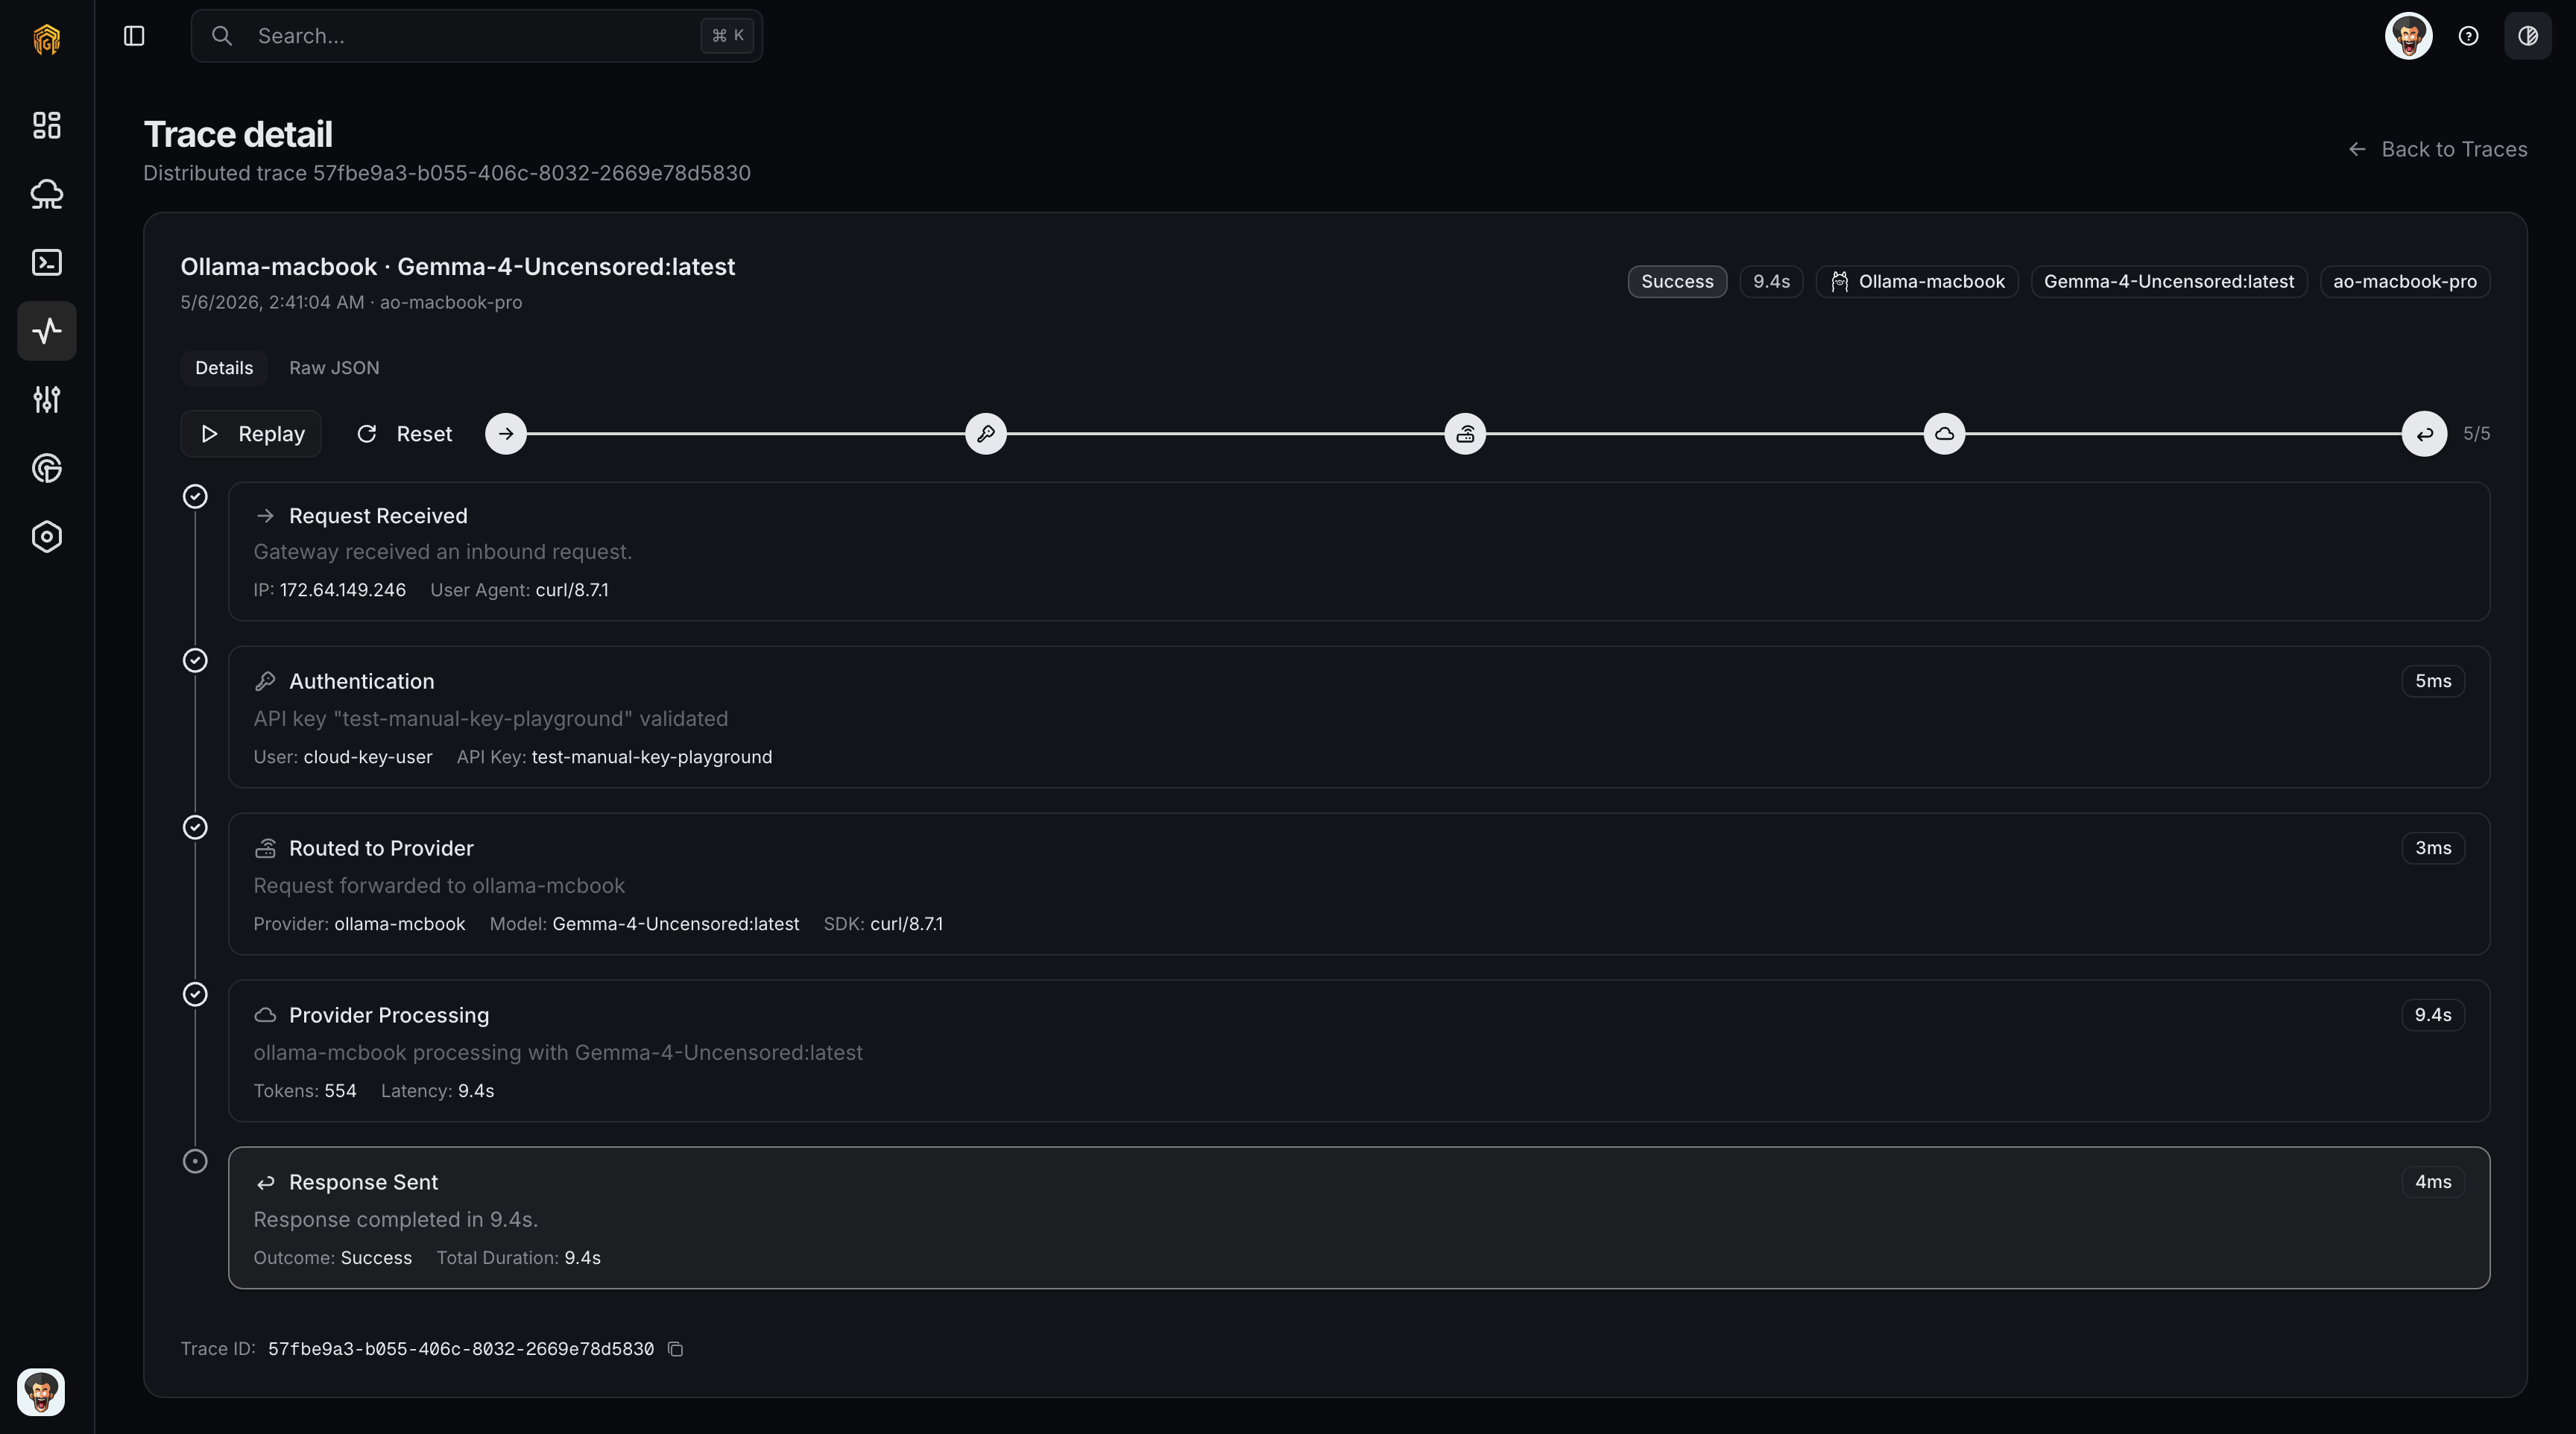
A trace is a timeline of the steps a request went through inside the gateway. Each step has an icon:
| Icon | Step |
| ------ | ----------------------------------------------------------------------- |
| Shield | Guardrail evaluation (PII, hate speech, prompt injection, keyword, IP). |
| Key | Authentication and quota check. |
| Router | Routing rule match + provider selection. |
| Cloud | Upstream model call. |
| Cache | Cache hit or miss. |
Click a step to see its latency, tokens consumed, cost contribution, and any error. The entire trace is time-aligned, so a slow guardrail or a stuck provider call stands out immediately.
## Traces
A trace is a timeline of the steps a request went through inside the gateway. Each step has an icon:
| Icon | Step |
| ------ | ----------------------------------------------------------------------- |
| Shield | Guardrail evaluation (PII, hate speech, prompt injection, keyword, IP). |
| Key | Authentication and quota check. |
| Router | Routing rule match + provider selection. |
| Cloud | Upstream model call. |
| Cache | Cache hit or miss. |
Click a step to see its latency, tokens consumed, cost contribution, and any error. The entire trace is time-aligned, so a slow guardrail or a stuck provider call stands out immediately.
 ## How to configure
There is no configuration on this page itself — Logs is read-only. To change what gets captured:
[Configuration → API Keys](/platform/configuration/api-keys) determines which key labels show up in the **API Key** filter.
[Configuration → Security](/platform/configuration/security) controls what shows up in the **Guardrails** tab.
Log retention is set per gateway in the gateway environment. See [Environment](/guardway-gateway/environment).
## Exports
From any tab, click **Export** to download the current filter as CSV or JSON. Exports are assembled locally on the gateway; the dashboard only forwards the query.
## Related
* [Audit log](/platform/settings/audit-log) — administrative actions, recorded centrally on the platform.
* [Configuration → Security](/platform/configuration/security) — rules whose triggers show up in the Guardrails tab.
* [Notifications](/platform/settings/notifications) — push these events to webhooks.
## How to configure
There is no configuration on this page itself — Logs is read-only. To change what gets captured:
[Configuration → API Keys](/platform/configuration/api-keys) determines which key labels show up in the **API Key** filter.
[Configuration → Security](/platform/configuration/security) controls what shows up in the **Guardrails** tab.
Log retention is set per gateway in the gateway environment. See [Environment](/guardway-gateway/environment).
## Exports
From any tab, click **Export** to download the current filter as CSV or JSON. Exports are assembled locally on the gateway; the dashboard only forwards the query.
## Related
* [Audit log](/platform/settings/audit-log) — administrative actions, recorded centrally on the platform.
* [Configuration → Security](/platform/configuration/security) — rules whose triggers show up in the Guardrails tab.
* [Notifications](/platform/settings/notifications) — push these events to webhooks.