> ## Documentation Index
> Fetch the complete documentation index at: https://docs.guardway.ai/llms.txt
> Use this file to discover all available pages before exploring further.
# Usage
> Track requests, tokens, and latency across gateways, teams, API keys, providers, and models.
## What this is for
**Dashboard → Usage** aggregates request and token telemetry from every attached gateway into one view. Use it to find which apps drive the most traffic, compare provider/model behavior over time, and inform routing or quota decisions.
For cost, see the sibling [Spend](/platform/dashboard/spend) tab. For guardrail analytics, see [Security](/platform/dashboard/security).
## Options
### Time range
Same dropdown that drives Overview: `Last Hour`, `Last 24 Hours`, `Last 7 Days`, `Last 30 Days`.
### Filters
* **Gateway** — multi-select; leave empty for all.
* **Provider** — multi-select.
* **API Key** — multi-select.
### Breakdowns
| Breakdown | Why it's useful |
| ---------------- | ------------------------------------------------- |
| Per **gateway** | Spot a noisy environment or a regional imbalance. |
| Per **team** | Confirm fairness across business units. |
| Per **API key** | Find the application driving volume. |
| Per **provider** | Decide whether to switch a workload. |
| Per **model** | Latency / quality tradeoff analysis. |
Each view shows requests, prompt tokens, completion tokens, total tokens, and p50 / p95 latency over the selected time range.
## How to configure
This is a read-only analytics view — no configuration on the page itself.
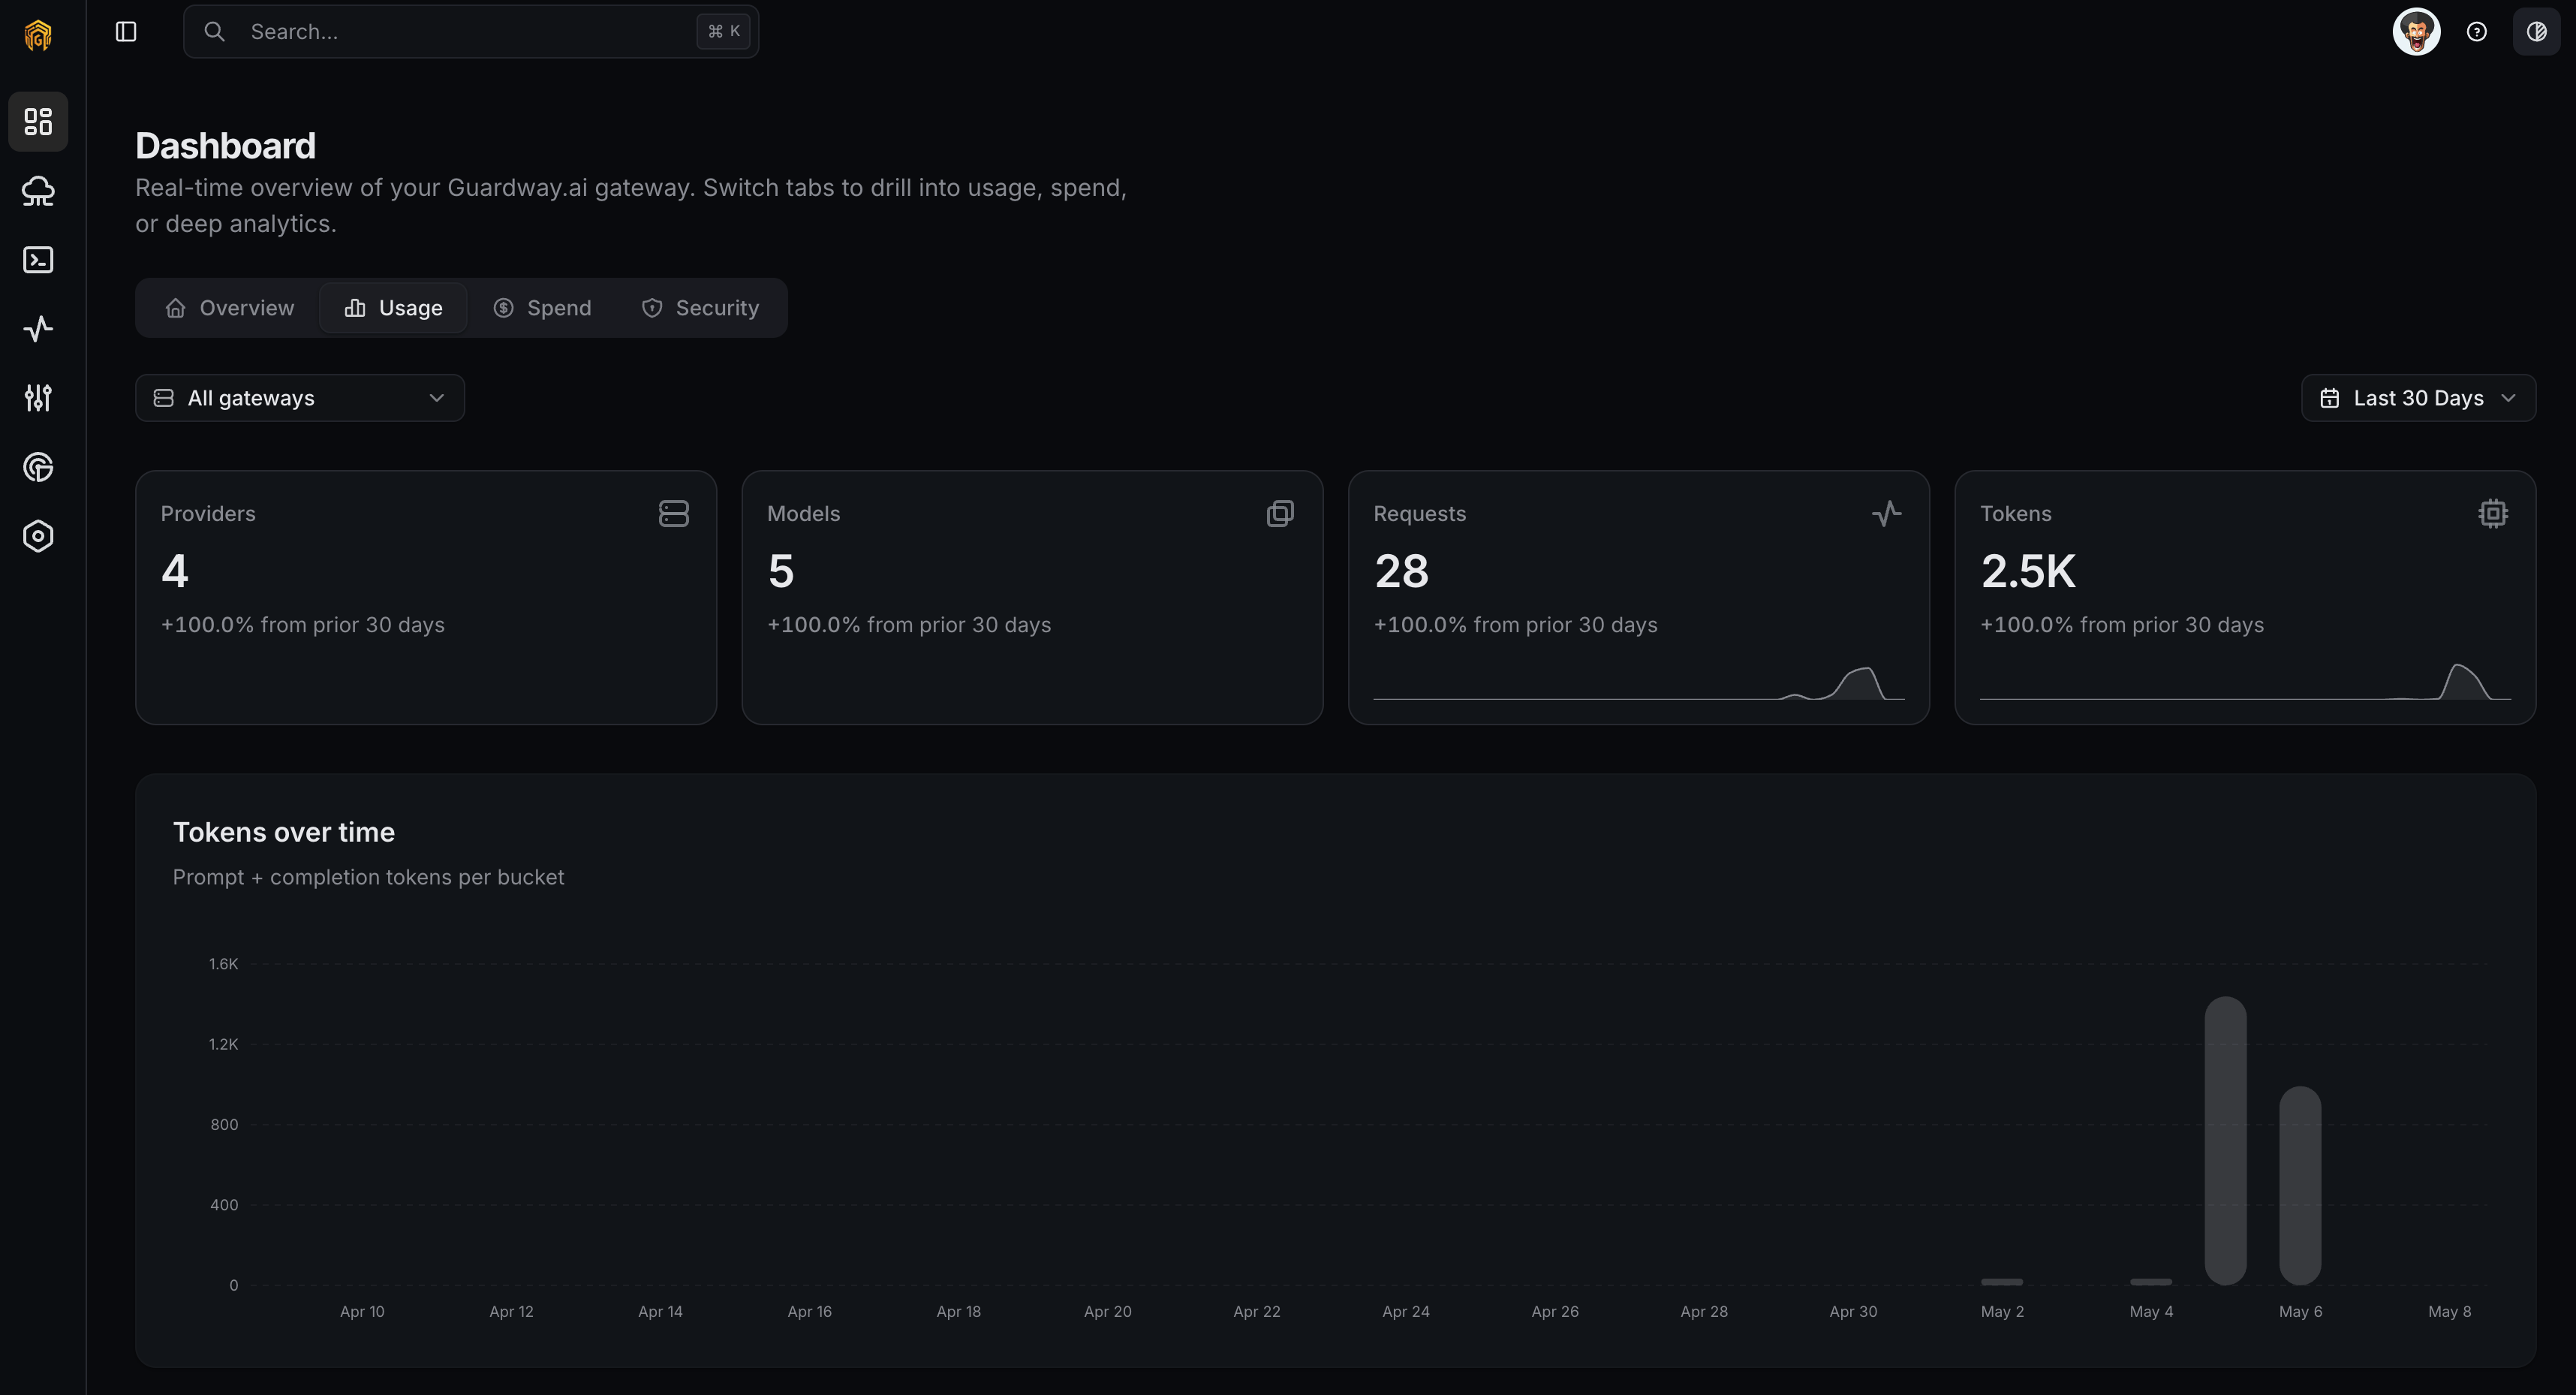 Open **Dashboard → Overview** from the dashboard sidebar and click the **Usage** tab.
Set the **Time range** dropdown.
Add **Gateway**, **Provider**, or **API Key** filters. Switch the **Group by** selector between gateway, team, API key, provider, and model.
Click **Export** to download the current filter as CSV or JSON. Useful for showback systems and finance.
## What this view does **not** show
Raw prompts and completions stay on the gateway. To inspect them, open [Logs](/platform/logs) while connected to that gateway. Administrative actions are recorded centrally on the [Audit log](/platform/settings/audit-log).
## Related
* [Spend](/platform/dashboard/spend) — cost view of the same telemetry.
* [Logs](/platform/logs) — request-level drill-in.
* [Notifications](/platform/settings/notifications) — alert when usage crosses a threshold.
Open **Dashboard → Overview** from the dashboard sidebar and click the **Usage** tab.
Set the **Time range** dropdown.
Add **Gateway**, **Provider**, or **API Key** filters. Switch the **Group by** selector between gateway, team, API key, provider, and model.
Click **Export** to download the current filter as CSV or JSON. Useful for showback systems and finance.
## What this view does **not** show
Raw prompts and completions stay on the gateway. To inspect them, open [Logs](/platform/logs) while connected to that gateway. Administrative actions are recorded centrally on the [Audit log](/platform/settings/audit-log).
## Related
* [Spend](/platform/dashboard/spend) — cost view of the same telemetry.
* [Logs](/platform/logs) — request-level drill-in.
* [Notifications](/platform/settings/notifications) — alert when usage crosses a threshold.