> ## Documentation Index
> Fetch the complete documentation index at: https://docs.guardway.ai/llms.txt
> Use this file to discover all available pages before exploring further.
# Security
> Guardrail activity, severity breakdowns, and MCP traffic across every attached gateway.
## What this is for
**Dashboard → Security** summarizes guardrail evaluations and MCP traffic from every attached gateway. Use it to spot bursts of blocks, find the most-triggered policies, and confirm MCP servers are getting the volume you expect.
For request and token volume, see [Usage](/platform/dashboard/usage). For cost, see [Spend](/platform/dashboard/spend). To inspect individual events, open [Logs](/platform/logs) on the relevant gateway.
## Options
### Time range
`Last 24 Hours`, `Last 7 Days`, `Last 30 Days`. Comparisons against the previous window appear next to each stat.
### Filters
* **Gateway** — multi-select; leave empty for all attached gateways.
### Stat blocks
| Block | Metric |
| ------------------- | --------------------------------------------------------- |
| **Total Blocks** | Requests blocked by a guardrail in the window. |
| **Total Events** | Every guardrail evaluation (block + warn + redact + log). |
| **MCP Requests** | Total MCP tool calls across all attached servers. |
| **MCP Avg Latency** | Mean MCP tool-call latency in milliseconds. |
### Charts and breakdowns
* **Blocks over time** — bucketed by the selected range.
* **MCP requests over time** — bucketed by the selected range.
* **By severity** — `Critical`, `High`, `Medium`, `Low` event counts.
* **Triggered on** — top categories that fired (e.g. PII detection, prompt injection, content filter).
* **Event type** — top event types observed.
* **Top MCP servers** — top 5 servers by request volume.
* **Top MCP tools** — top 5 tools by request volume.
If no guardrails fired and no MCP calls flowed in the window, the page shows an empty state instead of charts.
## How to configure
This is a read-only analytics view — guardrail policies and MCP servers are configured on [Configuration → Security](/platform/configuration/security).
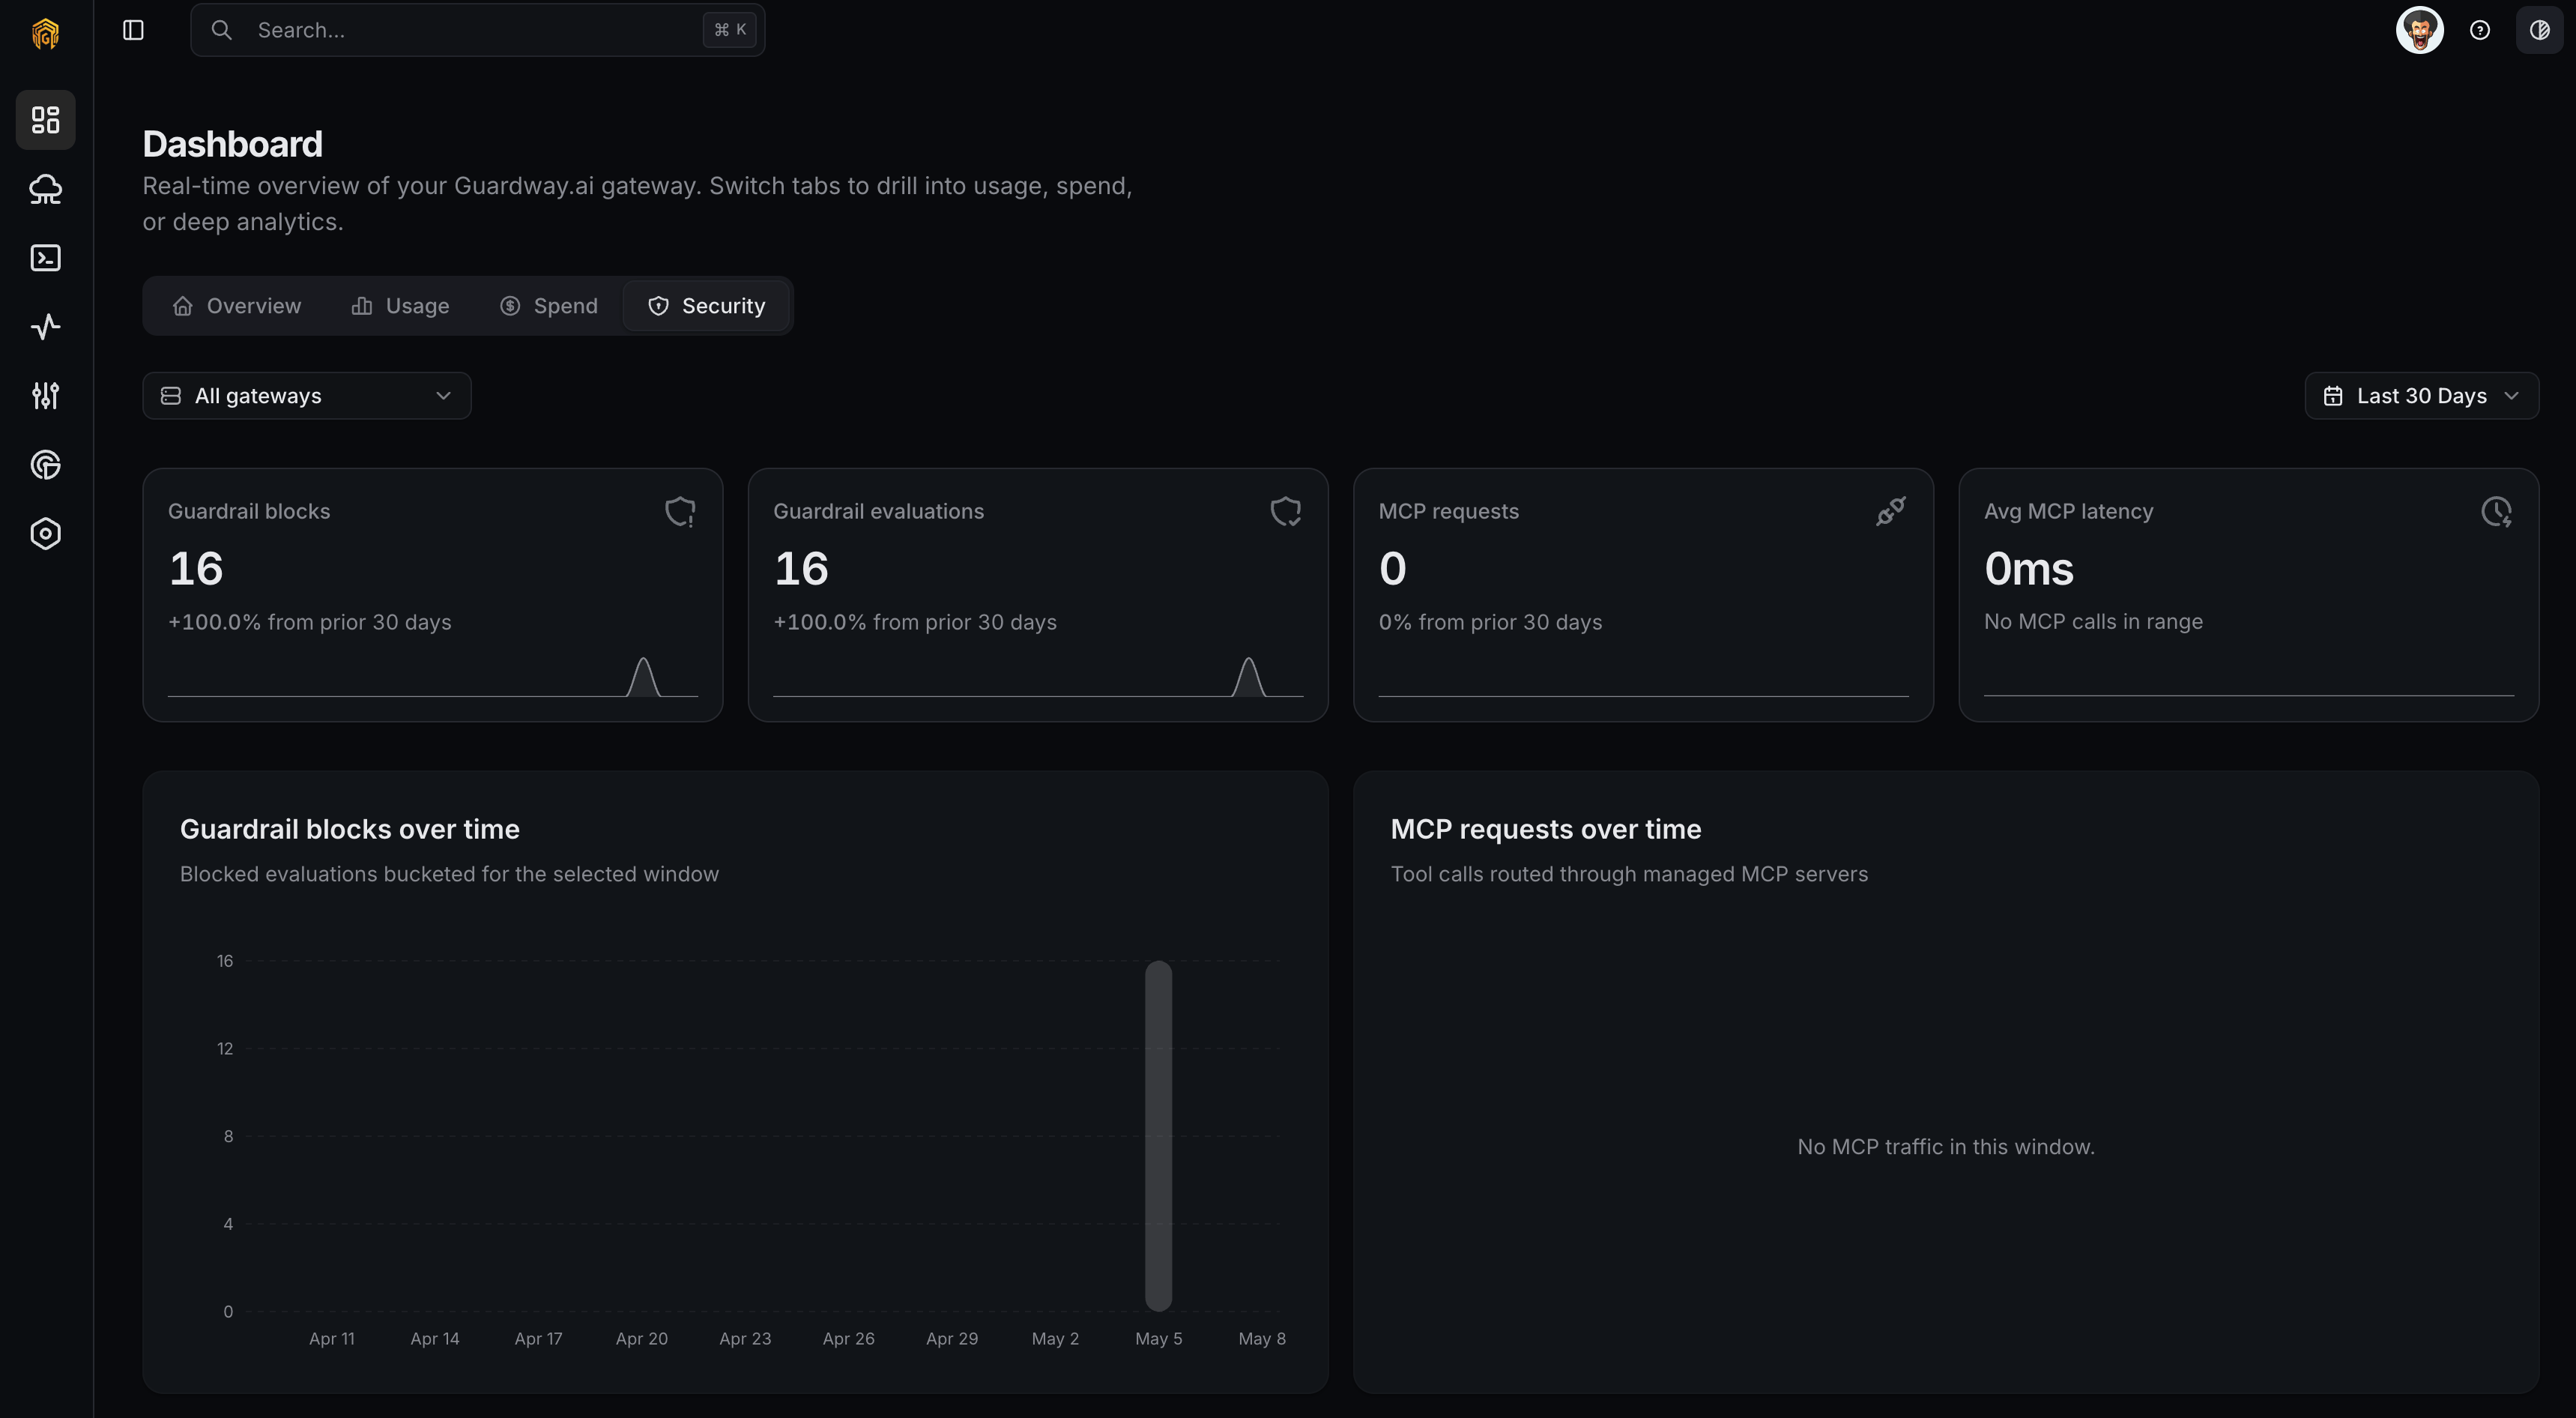 Open **Dashboard → Overview** from the dashboard sidebar and click the **Security** tab.
Set **Time range** and optionally narrow to specific gateways with the **Gateway** filter.
Use the **Triggered on** breakdown to identify which guardrail fired most. Open [Logs → Guardrails](/platform/logs) on the affected gateway to inspect individual evaluations.
If a guardrail is over-firing or under-firing, adjust thresholds and actions on [Configuration → Security](/platform/configuration/security).
## Related
* [Configuration → Security](/platform/configuration/security) — guardrail policies, SLM Guardrails, MCP servers.
* [Logs](/platform/logs) — guardrail evaluation and MCP request logs on a specific gateway.
* [Notifications](/platform/settings/notifications) — fire on `guardrail.violation`.
Open **Dashboard → Overview** from the dashboard sidebar and click the **Security** tab.
Set **Time range** and optionally narrow to specific gateways with the **Gateway** filter.
Use the **Triggered on** breakdown to identify which guardrail fired most. Open [Logs → Guardrails](/platform/logs) on the affected gateway to inspect individual evaluations.
If a guardrail is over-firing or under-firing, adjust thresholds and actions on [Configuration → Security](/platform/configuration/security).
## Related
* [Configuration → Security](/platform/configuration/security) — guardrail policies, SLM Guardrails, MCP servers.
* [Logs](/platform/logs) — guardrail evaluation and MCP request logs on a specific gateway.
* [Notifications](/platform/settings/notifications) — fire on `guardrail.violation`.