> ## Documentation Index
> Fetch the complete documentation index at: https://docs.guardway.ai/llms.txt
> Use this file to discover all available pages before exploring further.
# Overview
> At-a-glance health and traffic for every gateway in your organization.
## What this is for
**Dashboard → Overview** is the first page you see after signing in. It rolls up traffic, latency, errors, and gateway health into a single summary so you can spot regressions across all your gateways without drilling into individual pages.
Use it as the daily-driver page for "is everything working" and as the jump-off into Usage, Spend, and Security for deeper analysis.
## Options
### Time range
A single dropdown applies to every chart on the page:
* **Last Hour**
* **Last 24 Hours**
* **Last 7 Days**
* **Last 30 Days**
### Stat blocks
Top row summarizes the selected window with the headline number, a comparison vs. the previous window, and a sparkline:
| Block | Metric |
| ------------------- | -------------------------------------------------- |
| **Requests** | Total request count. |
| **Errors** | Failed-request count and error rate %. |
| **Latency** | p50 / p95 of provider response times. |
| **Cost** | Estimated USD spend across all attached providers. |
| **Active gateways** | Count of gateways currently `Healthy`. |
### Charts
* **Requests over time** — bucketed by the selected range.
* **Latency over time** — p50 and p95 lines.
* **Top providers / models** — bar chart of which providers and models drove the volume.
## How to configure
There is no configuration on this page — it reads from the same telemetry as Usage, Spend, and Security.
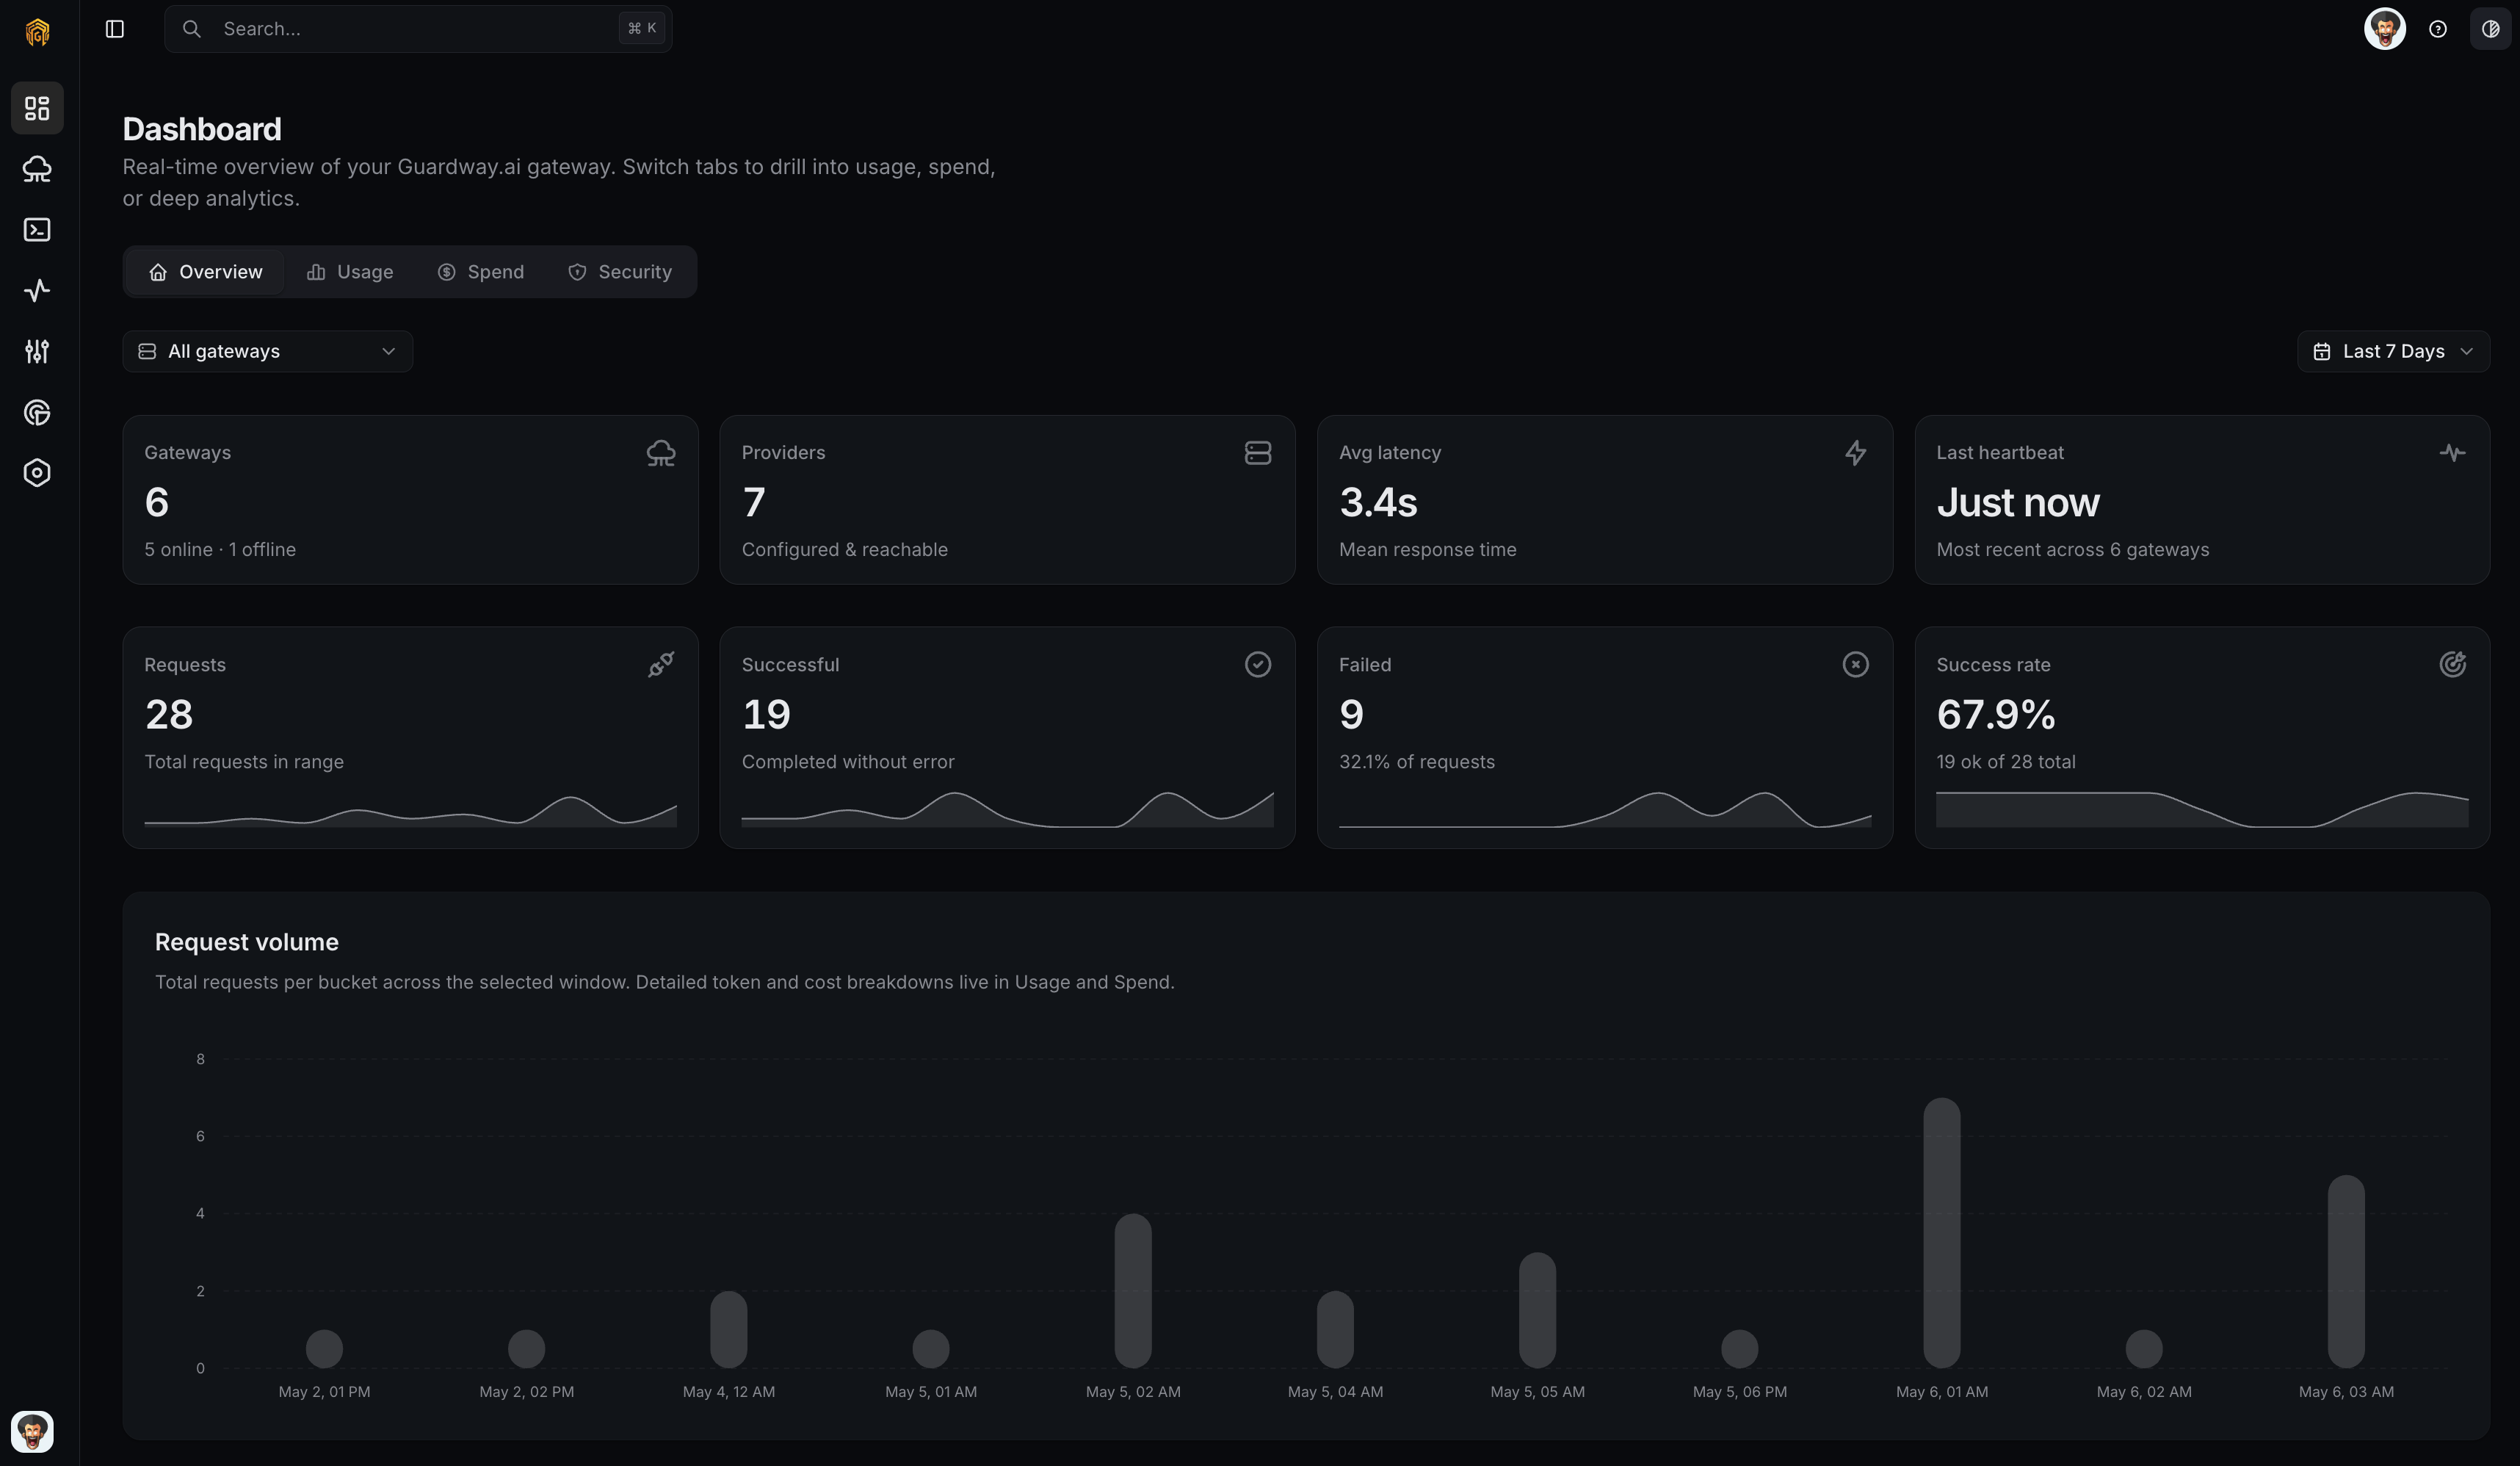 Open **Dashboard → Overview** from the dashboard sidebar.
Use the **Time range** dropdown. Comparisons and sparklines update for the new window.
Click any stat block to jump to its detail tab — Requests → [Usage](/platform/dashboard/usage), Cost → [Spend](/platform/dashboard/spend), Errors → [Security](/platform/dashboard/security).
## Related
* [Usage](/platform/dashboard/usage) — request and token breakdowns.
* [Spend](/platform/dashboard/spend) — cost per gateway, team, key, provider, model.
* [Security](/platform/dashboard/security) — guardrail and policy analytics.
* [Logs](/platform/logs) — drill from a chart to the underlying requests.
Open **Dashboard → Overview** from the dashboard sidebar.
Use the **Time range** dropdown. Comparisons and sparklines update for the new window.
Click any stat block to jump to its detail tab — Requests → [Usage](/platform/dashboard/usage), Cost → [Spend](/platform/dashboard/spend), Errors → [Security](/platform/dashboard/security).
## Related
* [Usage](/platform/dashboard/usage) — request and token breakdowns.
* [Spend](/platform/dashboard/spend) — cost per gateway, team, key, provider, model.
* [Security](/platform/dashboard/security) — guardrail and policy analytics.
* [Logs](/platform/logs) — drill from a chart to the underlying requests.